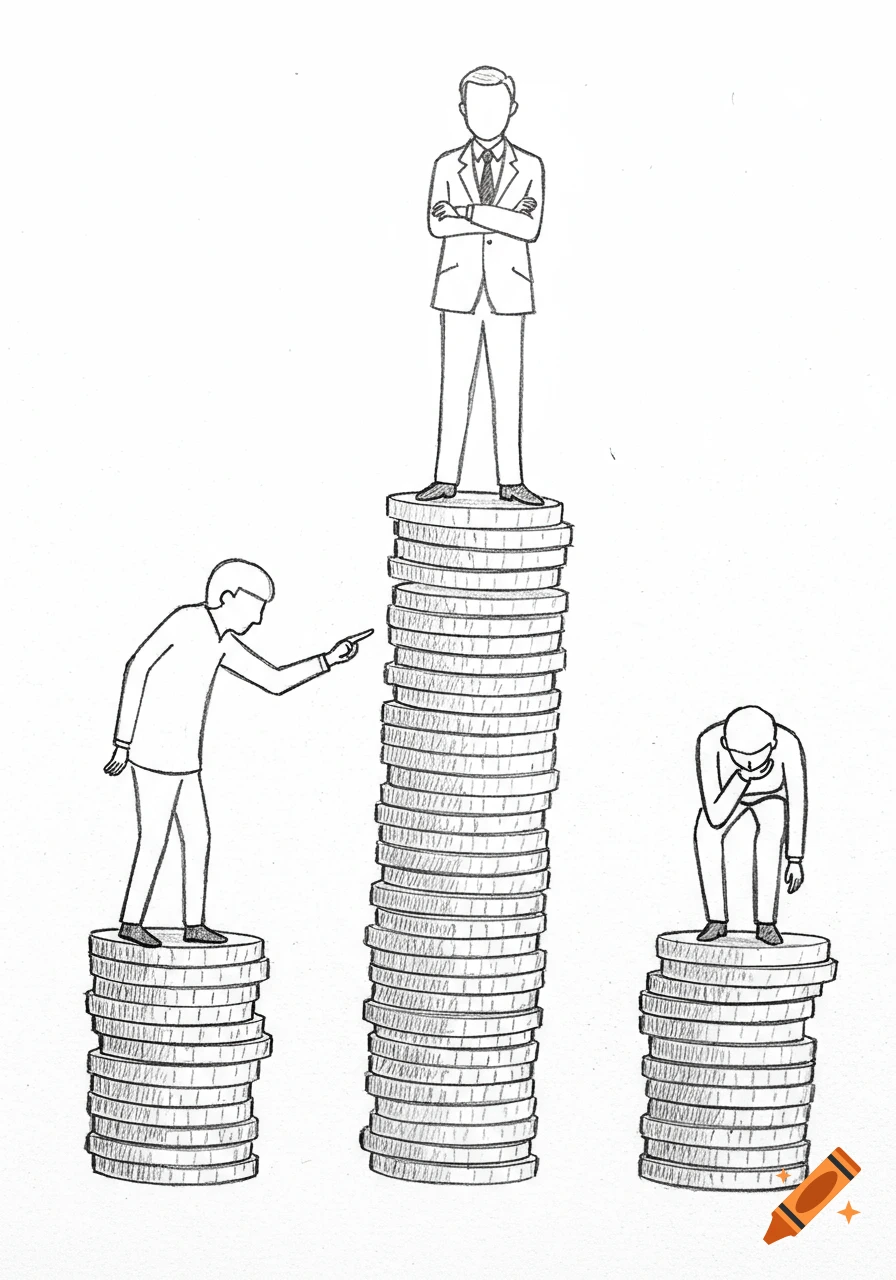
An economics diagram showing supply and demand curves, a subsidy area, and text discussing benefit distribution.
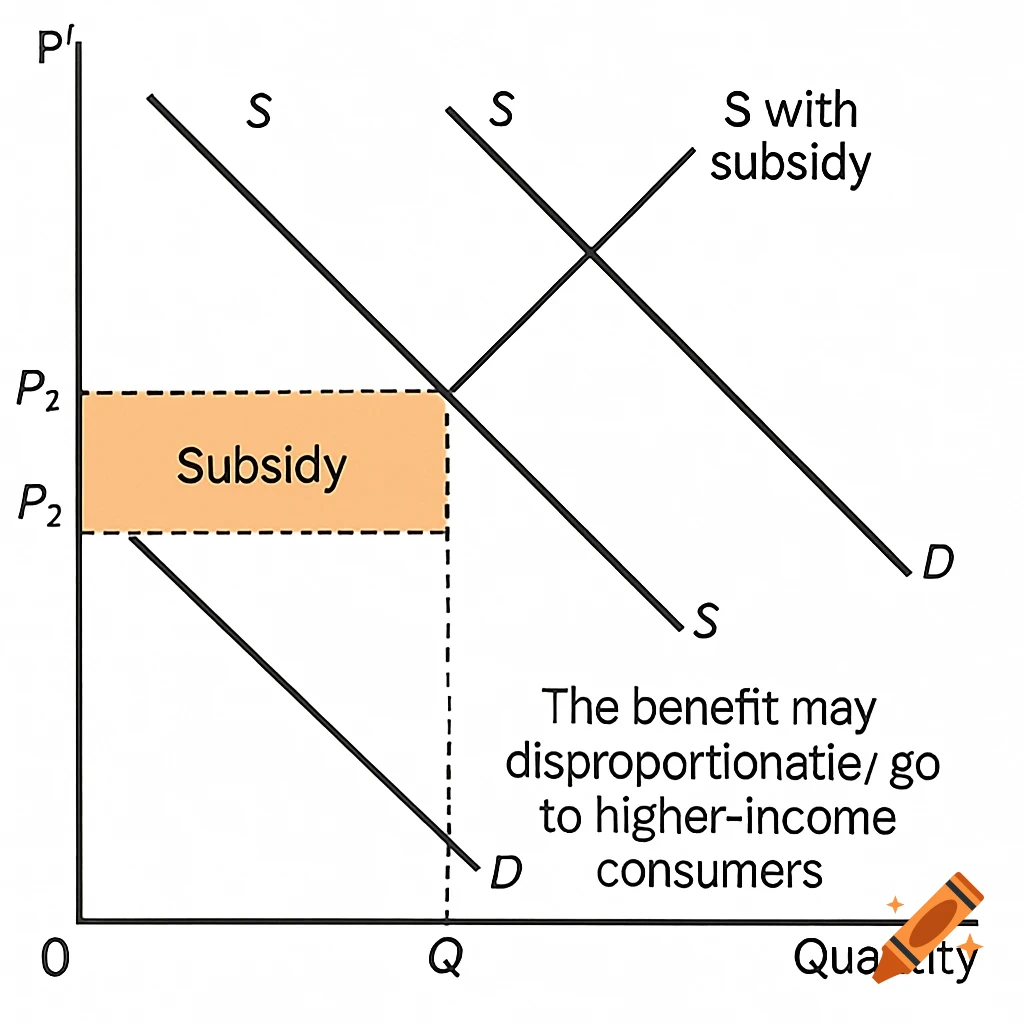
The diagram illustrating the subsidy effect on the EV market shows a rightward shift in the supply curve due to the subsidy, leading to a lower equilibrium price and a higher quantity of EVs sold. The area representing the subsidy is the vertical distance between the supply curves before and after the subsidy, multiplied by the quantity sold. This subsidy reduces the price consumers pay, encouraging more purchases. However, the benefit may be disproportionately received by higher-income consumers, raising concerns about equity. See more