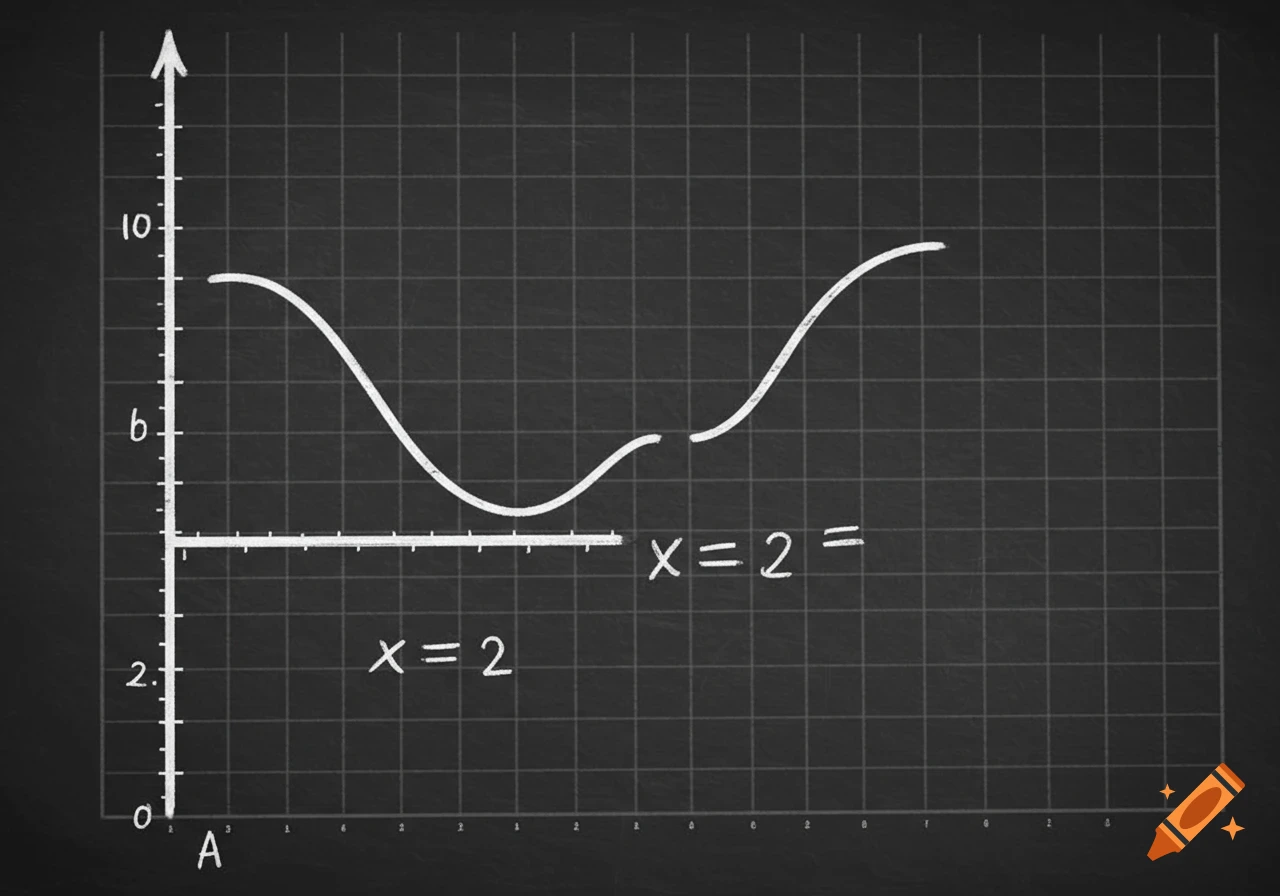
Graph of a rational function with vertical asymptote x=-2, slant asymptote y=x+2, and a hole at (-1, 2) on a grid.

"A precise graph of a rational function on a coordinate grid with x and y axes from -5 to 5. Key Features: Hole: An open circle (hollow circle) at the point (-1, 2). Vertical Asymptote: A dashed red vertical line at x = -2. Label it "x = -2". Slant Asymptote: A dashed blue line with the equation y = x + 2. Label it "y = x + 2". Graph Behavior: The graph has two distinct curves. Left Curve: For x < -2, the curve is in the top left quadrant. It approaches the vertical asymptote (x=-2) from the left and plunges downward to -∞. It also follows the slant asymptote (y=x+2) as it moves left. Right Curve: For x > -2 (but not at x=-1), the curve is in the top right quadrant. It approaches the vertical asymptote (x=-2) from the right and shoots upward to +∞. It has a hole at (-1, 2). For large positive x, it closely follows the slant asymptote (y=x+2) above the line. Style: Clean, textbook-style sketch on graph paper. Use black for the function's curve, red for the vertical asymptote, and blue for the slant asymptote." See more