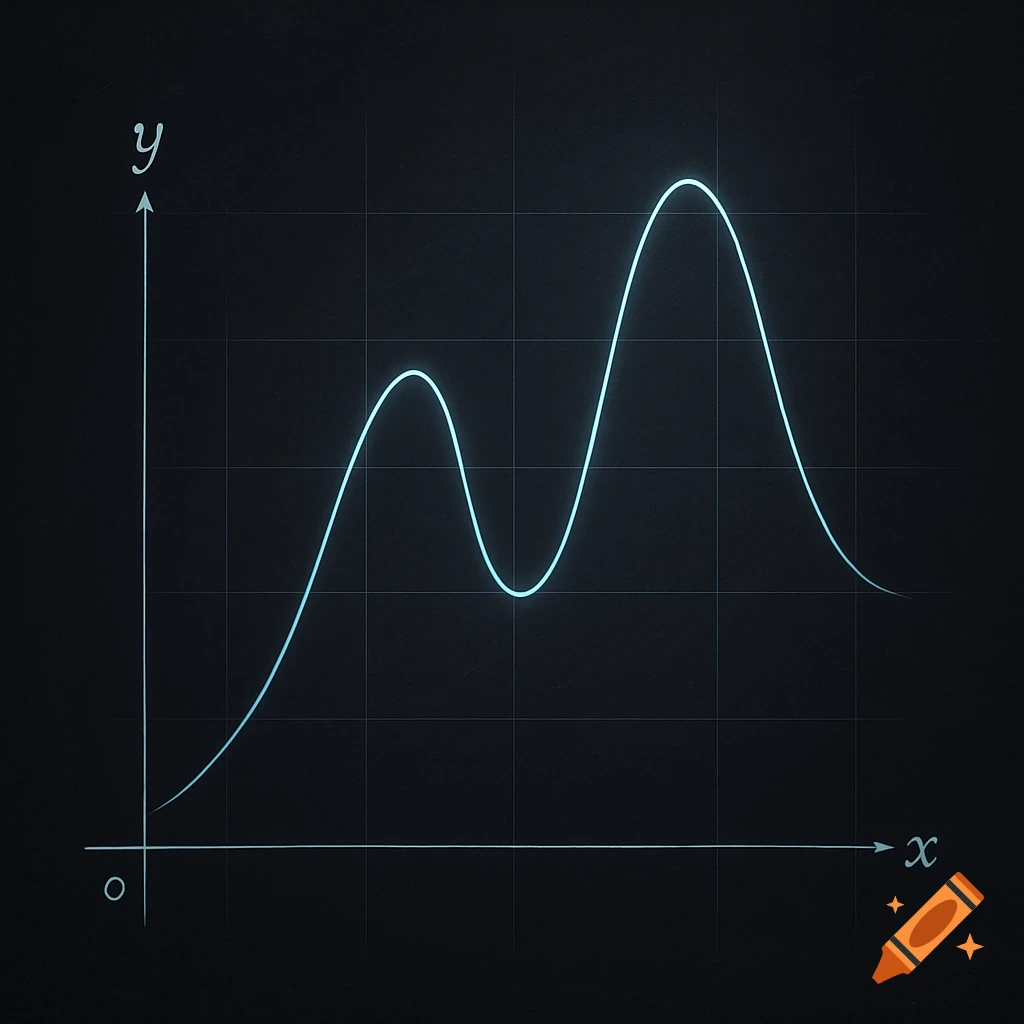
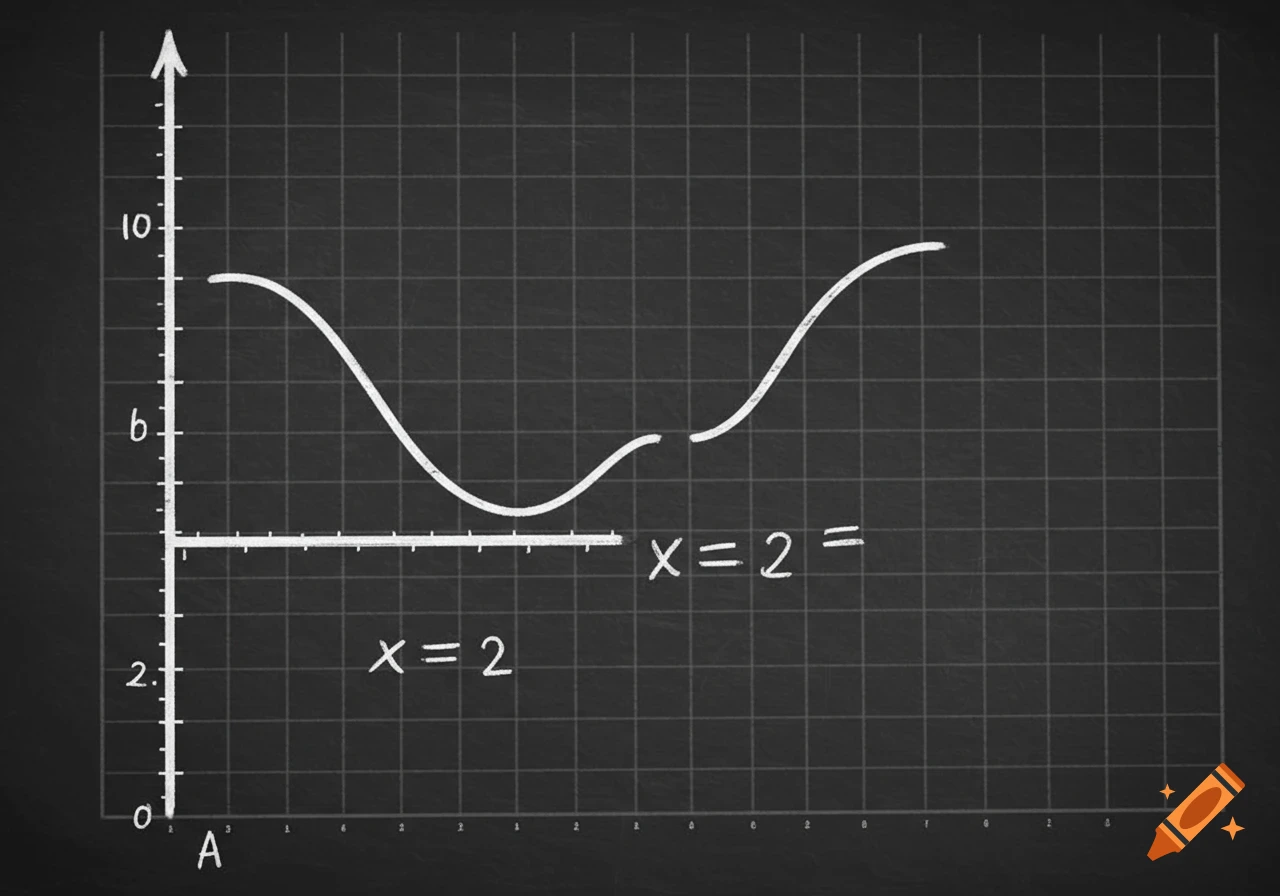
A hand-drawn style graph of a piecewise function on graph paper, showing three segments and labeled key points.

"A precise graph of a piecewise function on coordinate grid with x and y axes from -3 to 5. 1st piece: For x < 0, a straight line with equation y = -x. It ends with a solid black dot at the point (0, 0). 2nd piece: For 0 <= x <= 2, a parabolic curve with equation y = x². It begins with a solid black dot at (0, 0) and ends with a solid black dot at (2, 4). 3rd piece: For x > 2, a straight line with equation y = -x + 1. It begins with an open circle (hollow circle) at the point (2, -1) and continues to the right. Label the key points: (0,0), (2,4), and (2,-1). Style: clean, hand-drawn math textbook style on graph paper, black lines." See more