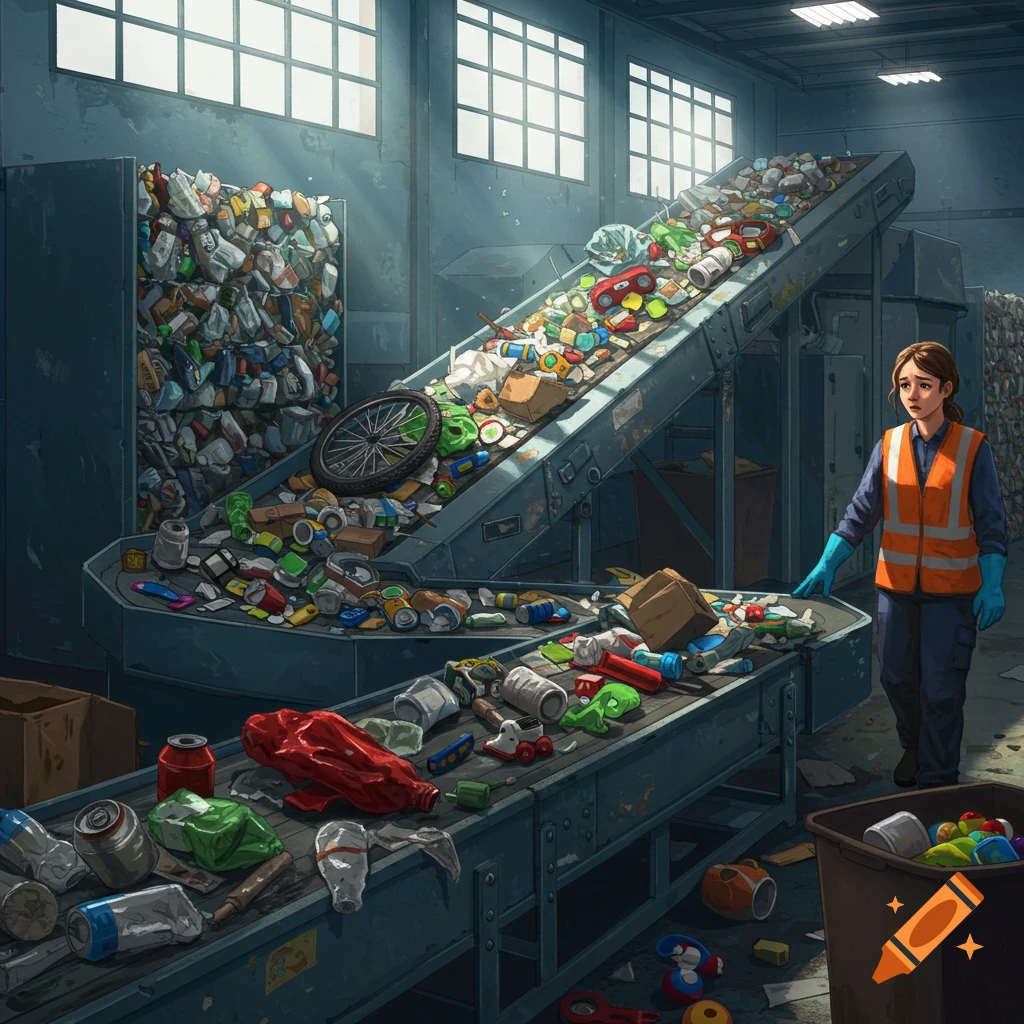
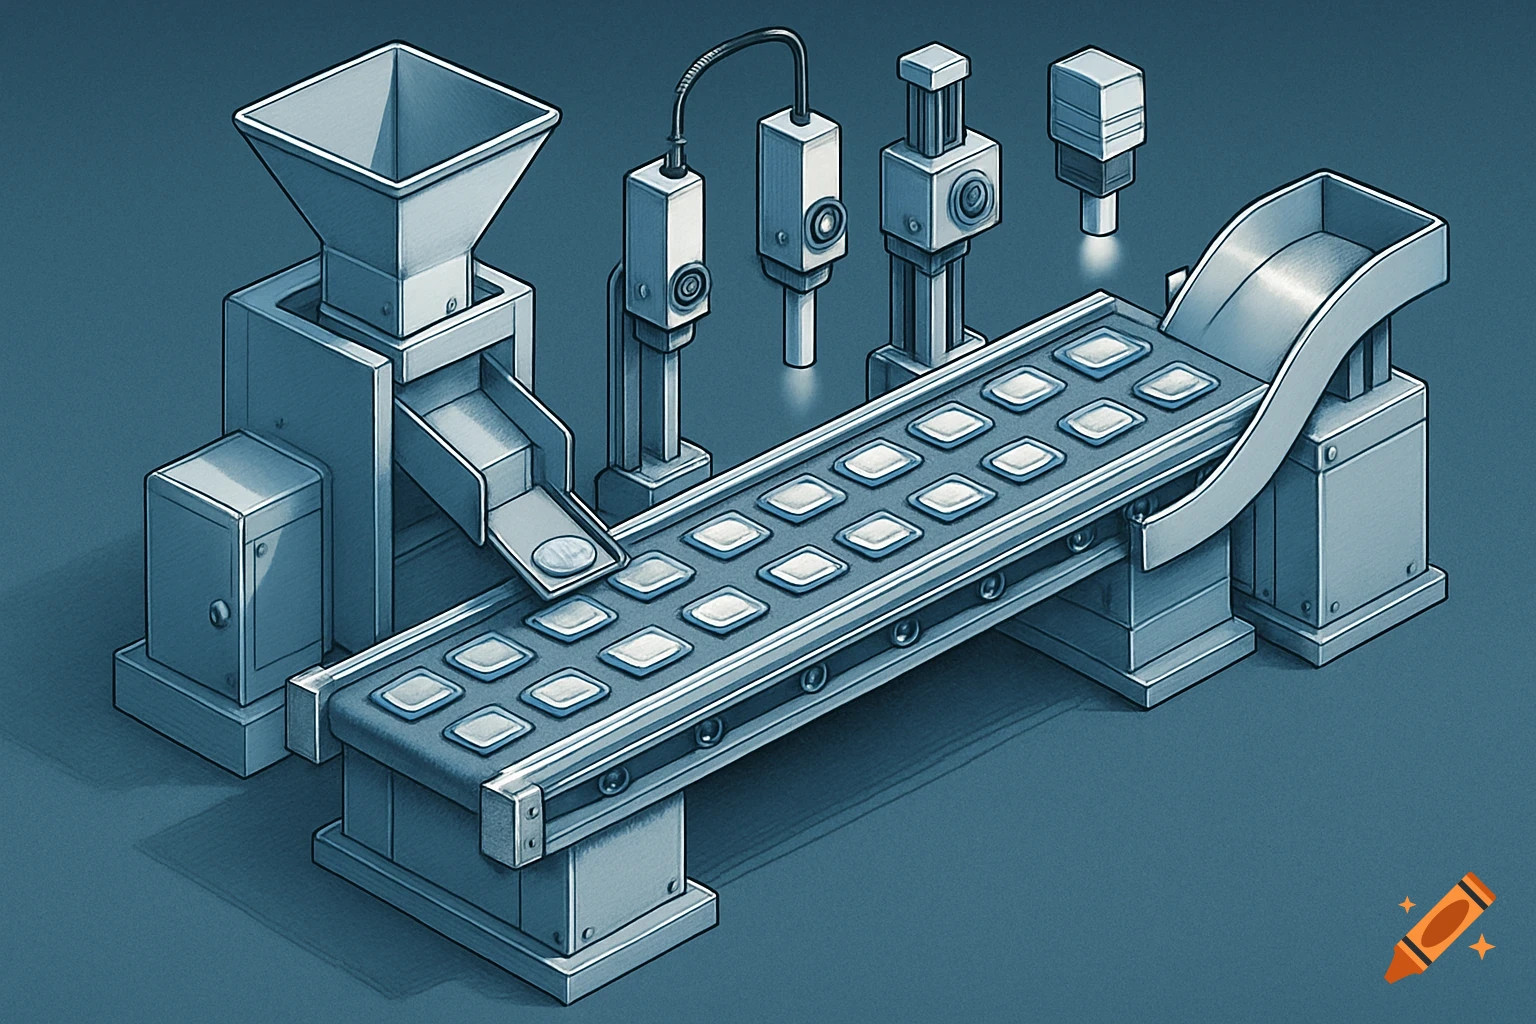
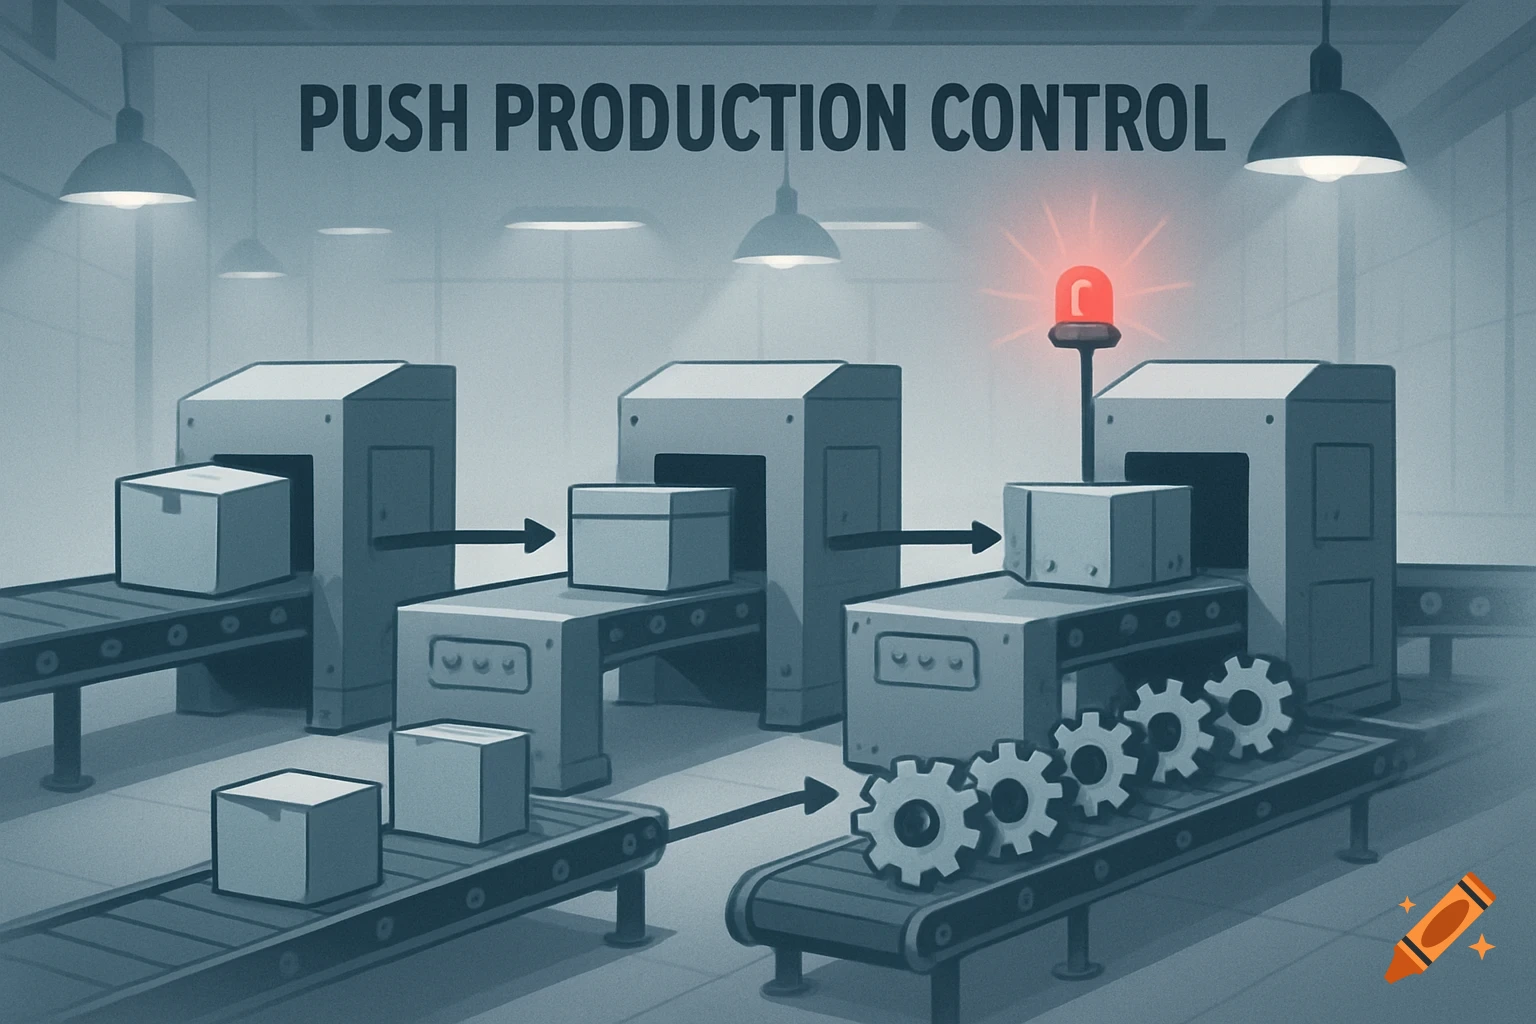
Flat infographic of a factory production line with robotic arm, bottles, waste bin, question mark, clipboard with red X, and a laptop with a chart.

Your Prompts (Ready to Copy and Paste) For Slide 2: 1 A flat, professional infographic-style diagram showing a simplified factory production line. At the end of the line, show a red waste bin icon with a large red question mark above it. Next to the waste bin, show a paper clipboard with a red ‘X’ marked on it, symbolising manual, inaccurate data collection. Background should be clean and minimal, using blues and greys, no text. For Slide 3: 1 Professional illustration of a fishbone (Ishikawa) diagram showing six categories (Man, Method, Machine, Material, Measurement, Environment). On the right side of the image, place icons representing Microsoft Excel, Python (snake icon), and Power BI (bar chart icon) feeding into a central glowing dashboard. Style should be clean, modern, and suitable for a quality engineering presentation. For Slide 4: 1 Minimalist flowchart diagram with 6 simple boxes connected by arrows from left to right. The boxes are labeled visually (no text needed) as follows: Proposal → Pilot Test → Feedback → SOP Document → Team Training → Full Rollout. Use icons like a document for proposal, a factory line for pilot, a speech bubble for feedback, a manual/book icon for SOP, a group of people for training, and a tick /checkmark for rollout. Colours should be corporate and clean – no clutter. For Slide 5: 1 Clean Power BI-style dashboard with a line graph showing a downward trend (material waste decreasing over time). Beside the graph, place three bold See more