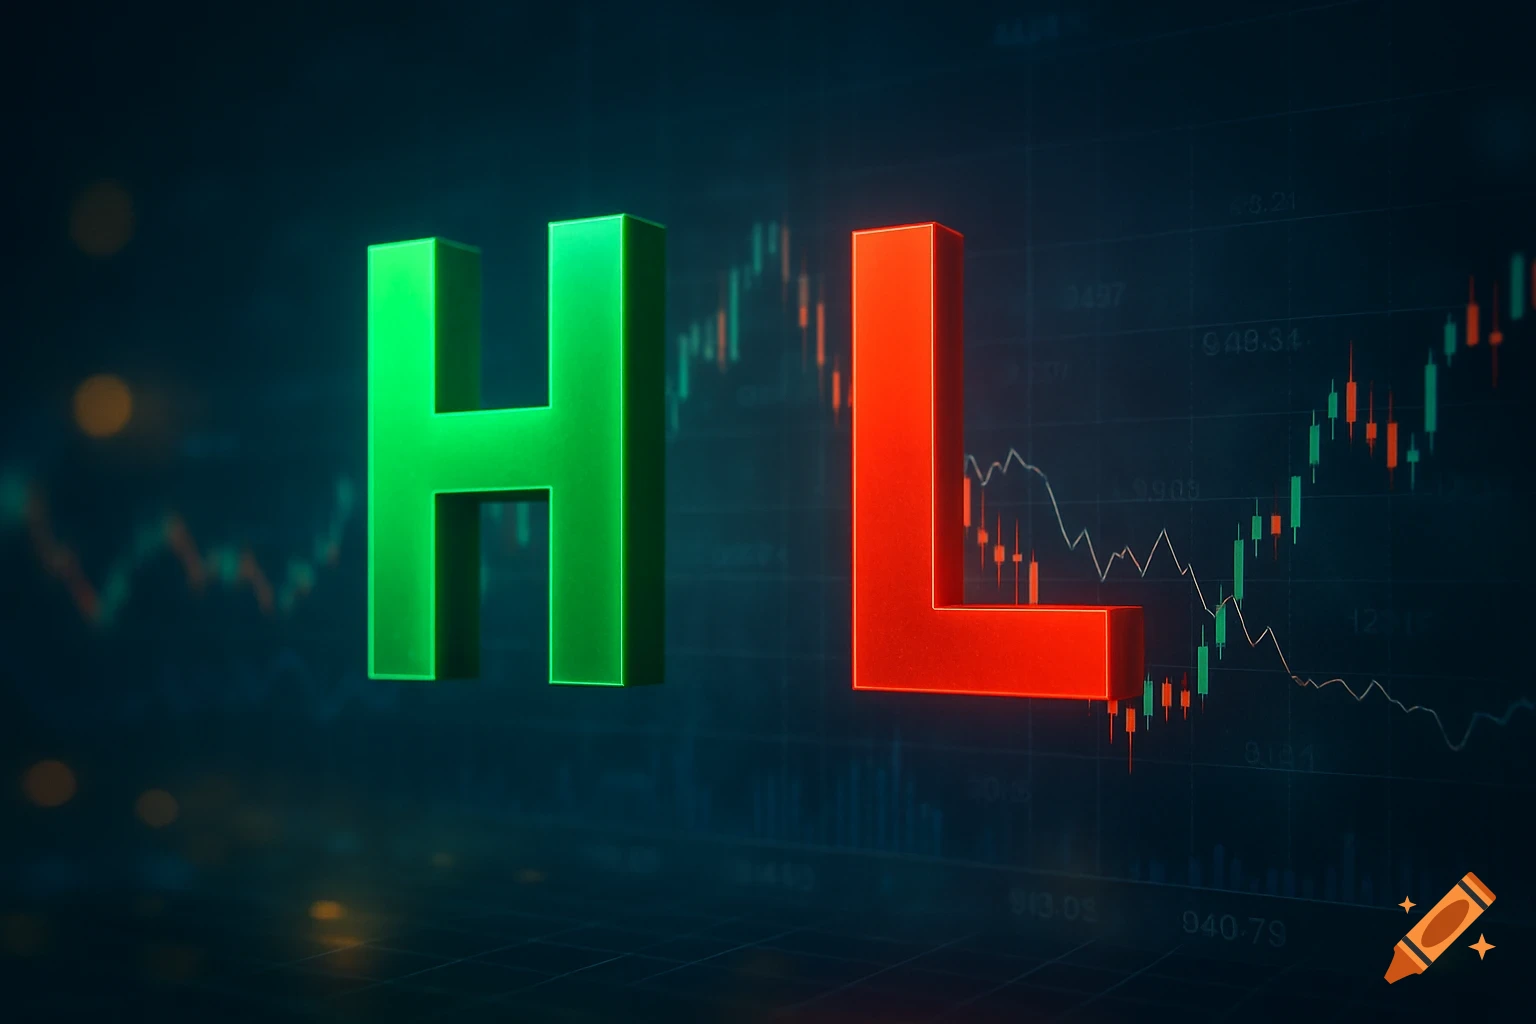
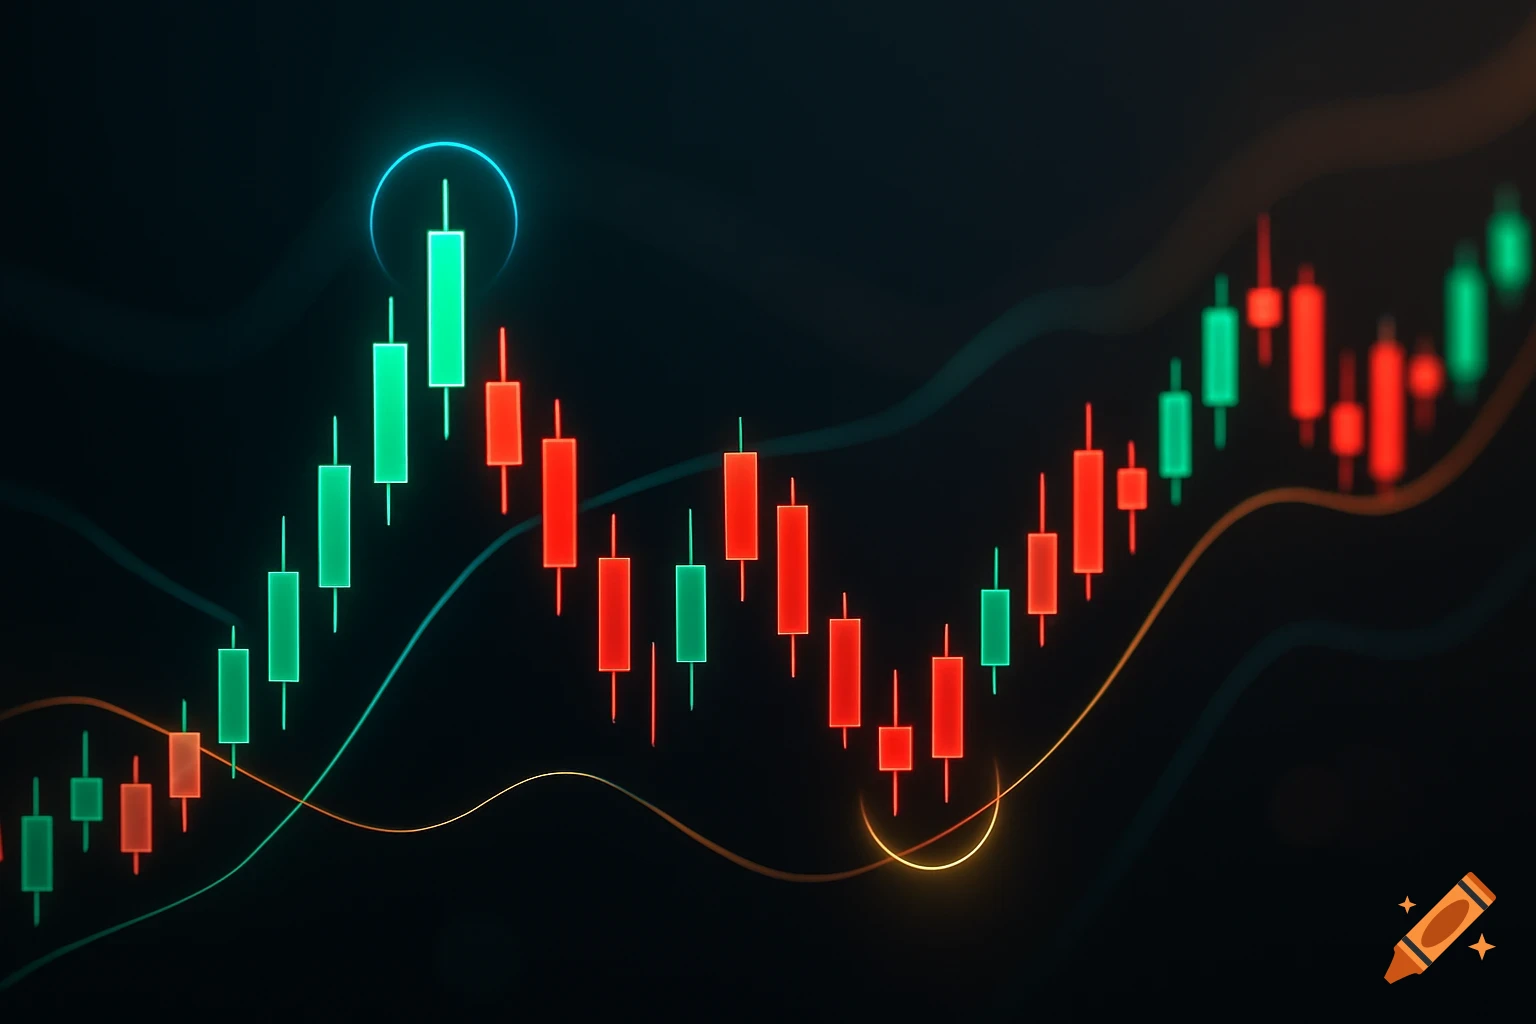
A financial infographic with two candlestick charts. The left chart shows a confirmed uptrend with green candles, labeled HH1, HL1, HL2. The right chart shows a confirmed downtrend with red candles, labeled LH1, LH2, LL2.
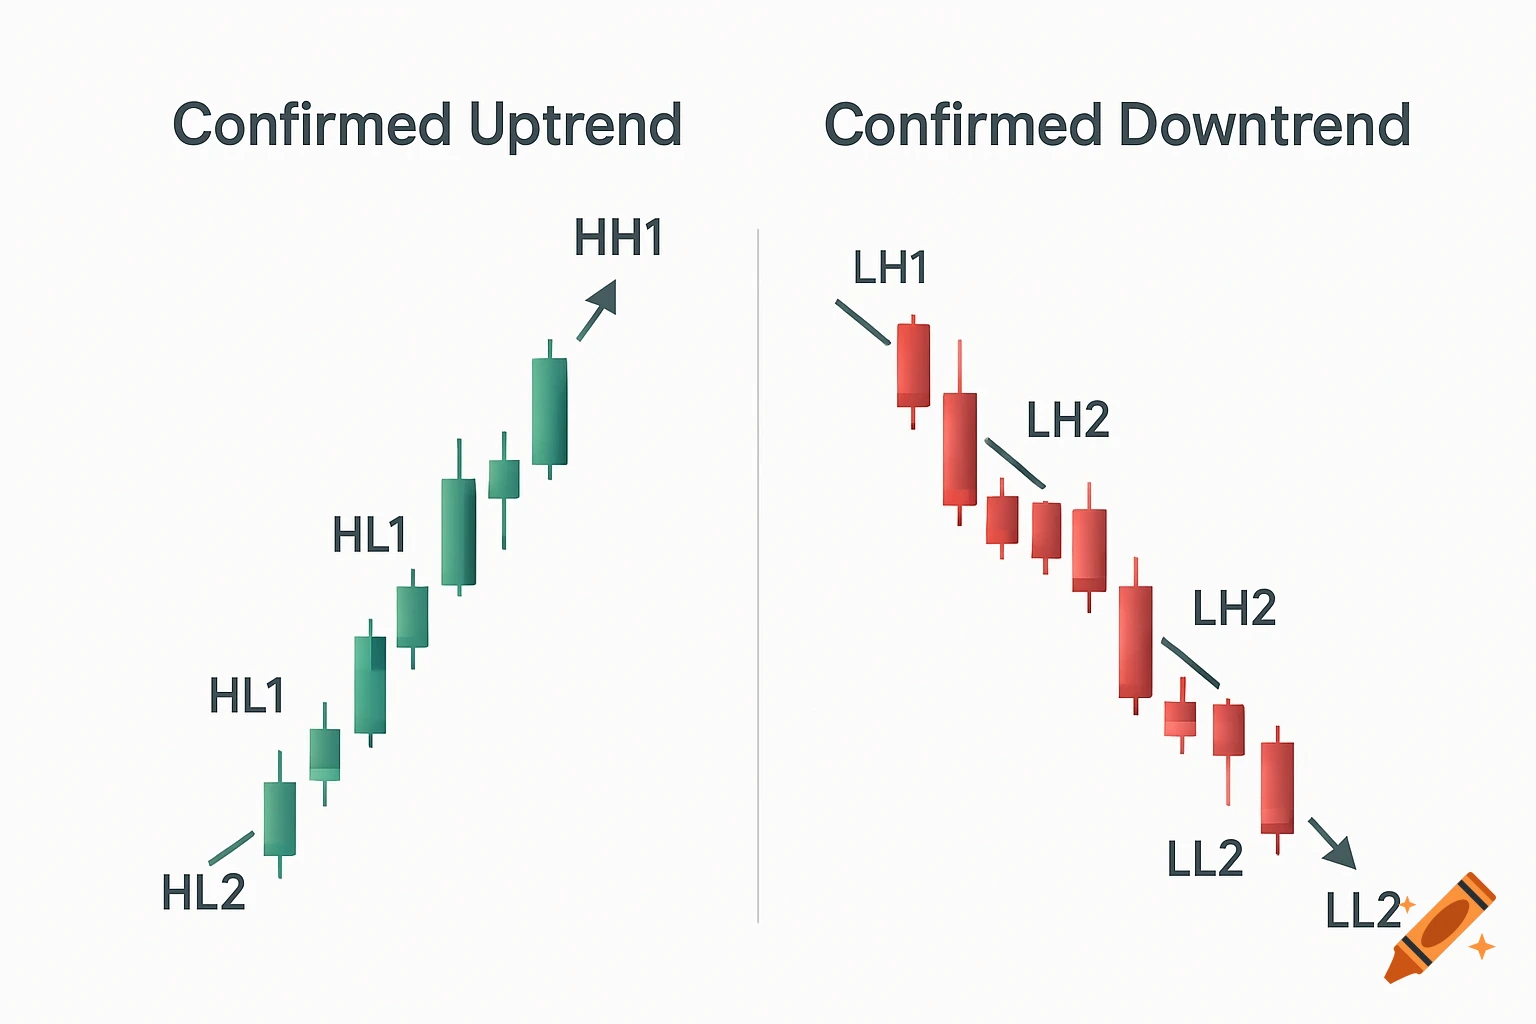
"A clean, professional financial infographic explaining market trends. On the left, a candlestick chart showing a confirmed uptrend with two consecutive higher highs (HH1, HH2) and two consecutive higher lows (HL1, HL2). On the right, a candlestick chart showing a confirmed downtrend with two consecutive lower lows (LL1, LL2) and two consecutive lower highs (LH1, LH2). Use arrows and labels to point to each HH, HL, LL, and LH. White background, modern style, educational diagram. Text is clear and easy to read." See more