Infographic with three pie charts showing 35% time reduction, 45% efficiency gains, 25% error reduction, with upward arrows and dollar signs.
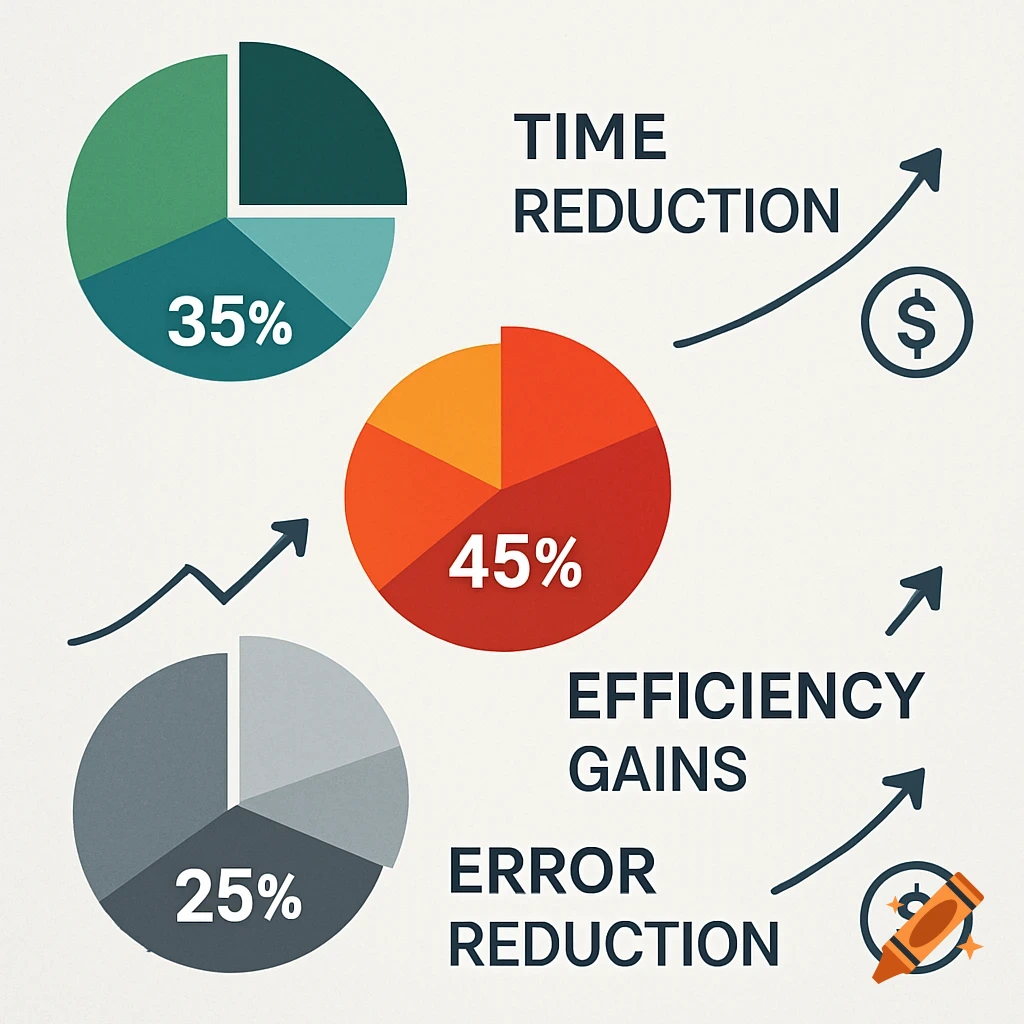
Professional infographic-style image showing key metrics and benefits - pie charts, upward trending arrows, cost savings icons, efficiency improvements. Include specific numbers mentioned in the article (35% time reduction, 45% efficiency gains, 25% error reduction). Modern, business-focused design. See more