A scatter plot showing data points with a dashed line of best fit labeled with coordinates (0,2) and (10,12), and the formula 'Slope = Rise/Run'.
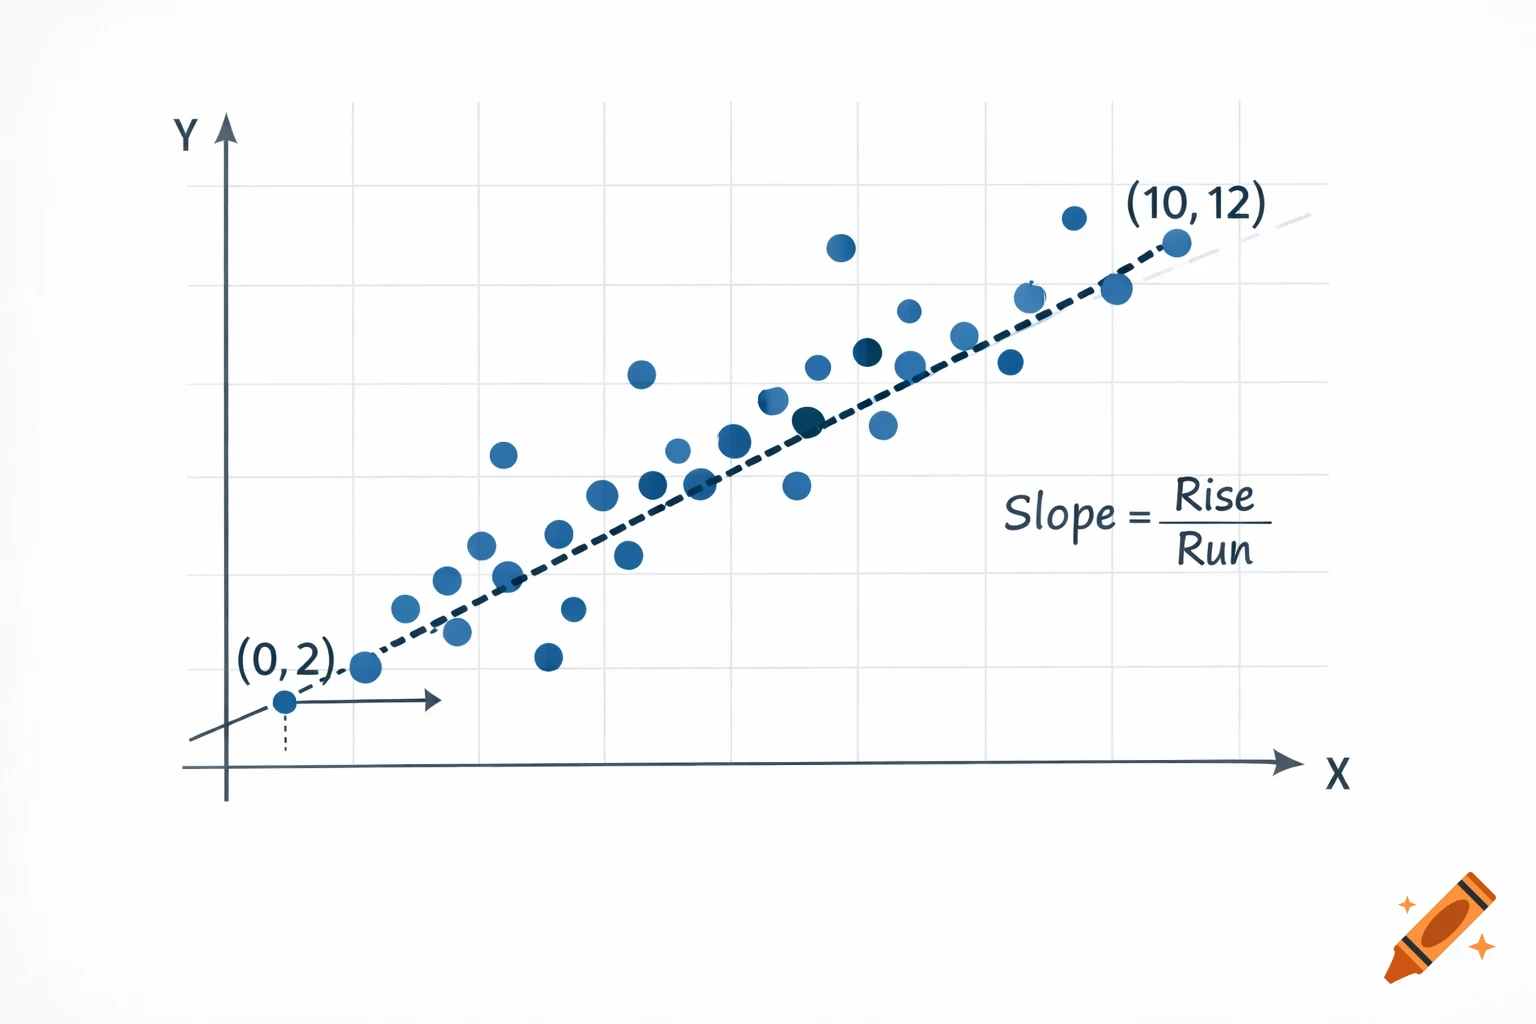
génère moi un graphique en te basant sur les informations suivantes : Analyse le graphique suivant (imagine un nuage de points qui monte graduellement de gauche à droite avec quelques points dispersés). a) La droite de meilleur ajustement aurait-elle une pente positive ou négative? b) Estime l'ordonnée à l'origine si la droite passe près de (0, 2). c) Si la droite passe approximativement par (0, 2) et (10, 12), calcule la pente. d) Écris l'équation de la droite de meilleur ajustement. See more