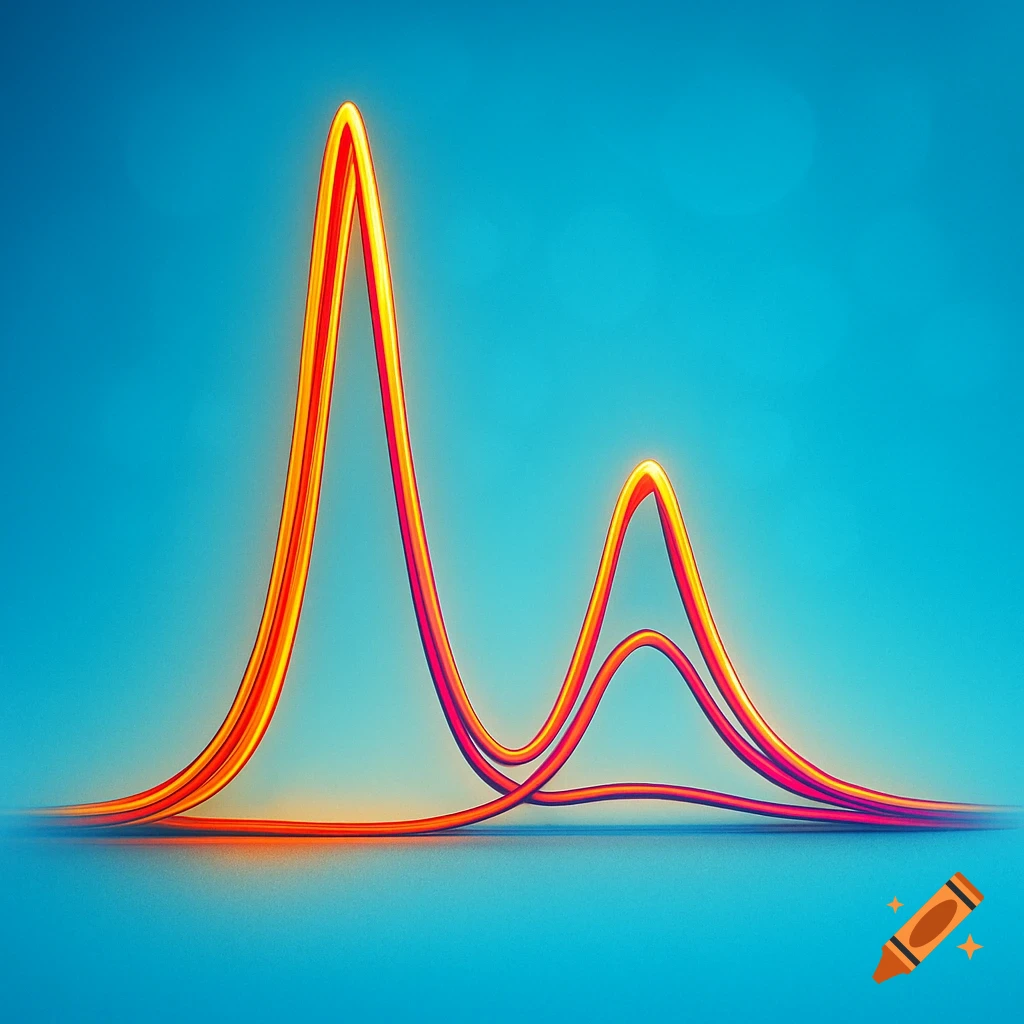
A biochemical graph illustrating enzyme activity: reaction velocity versus substrate concentration, comparing no inhibition to non-competitive inhibition.

Sketch and annotate a graph to show the effect of a non-competitive inhibitor on enzyme activity In this graph: The curve with the inhibitor has a lower maximum rate (Vmax) than the normal one. The Km stays the same, because the inhibitor doesn’t affect the binding of substrate to the enzyme’s active sites — it just makes some enzymes inactive. Summary: Vmax = decreased Km = unchanged See more