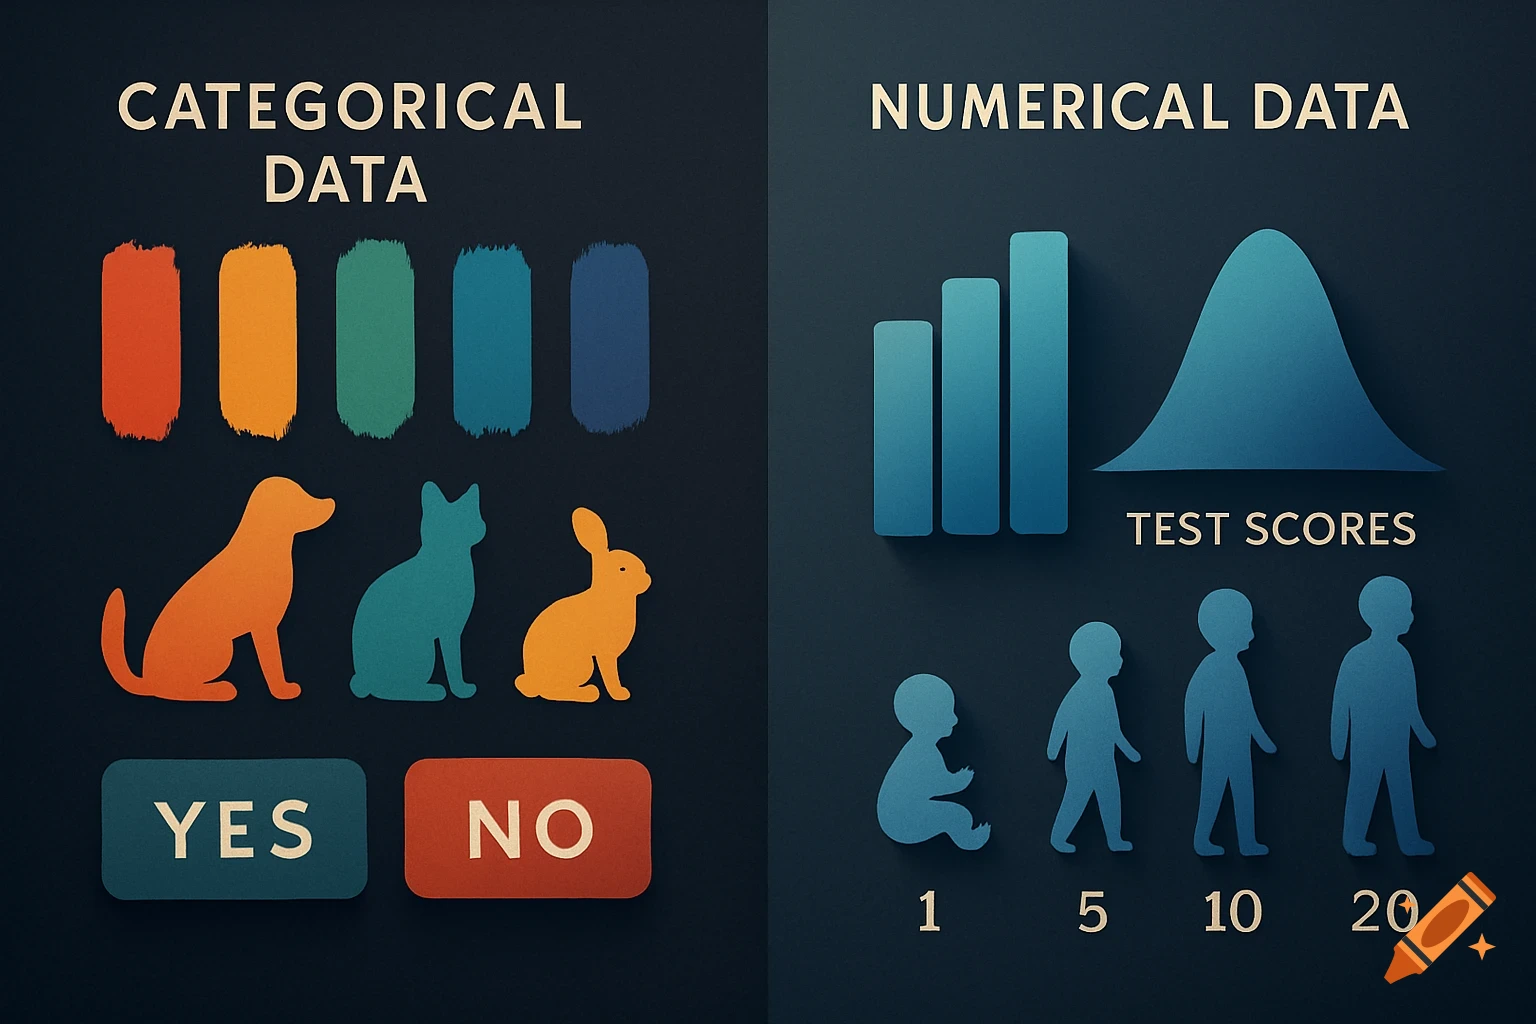
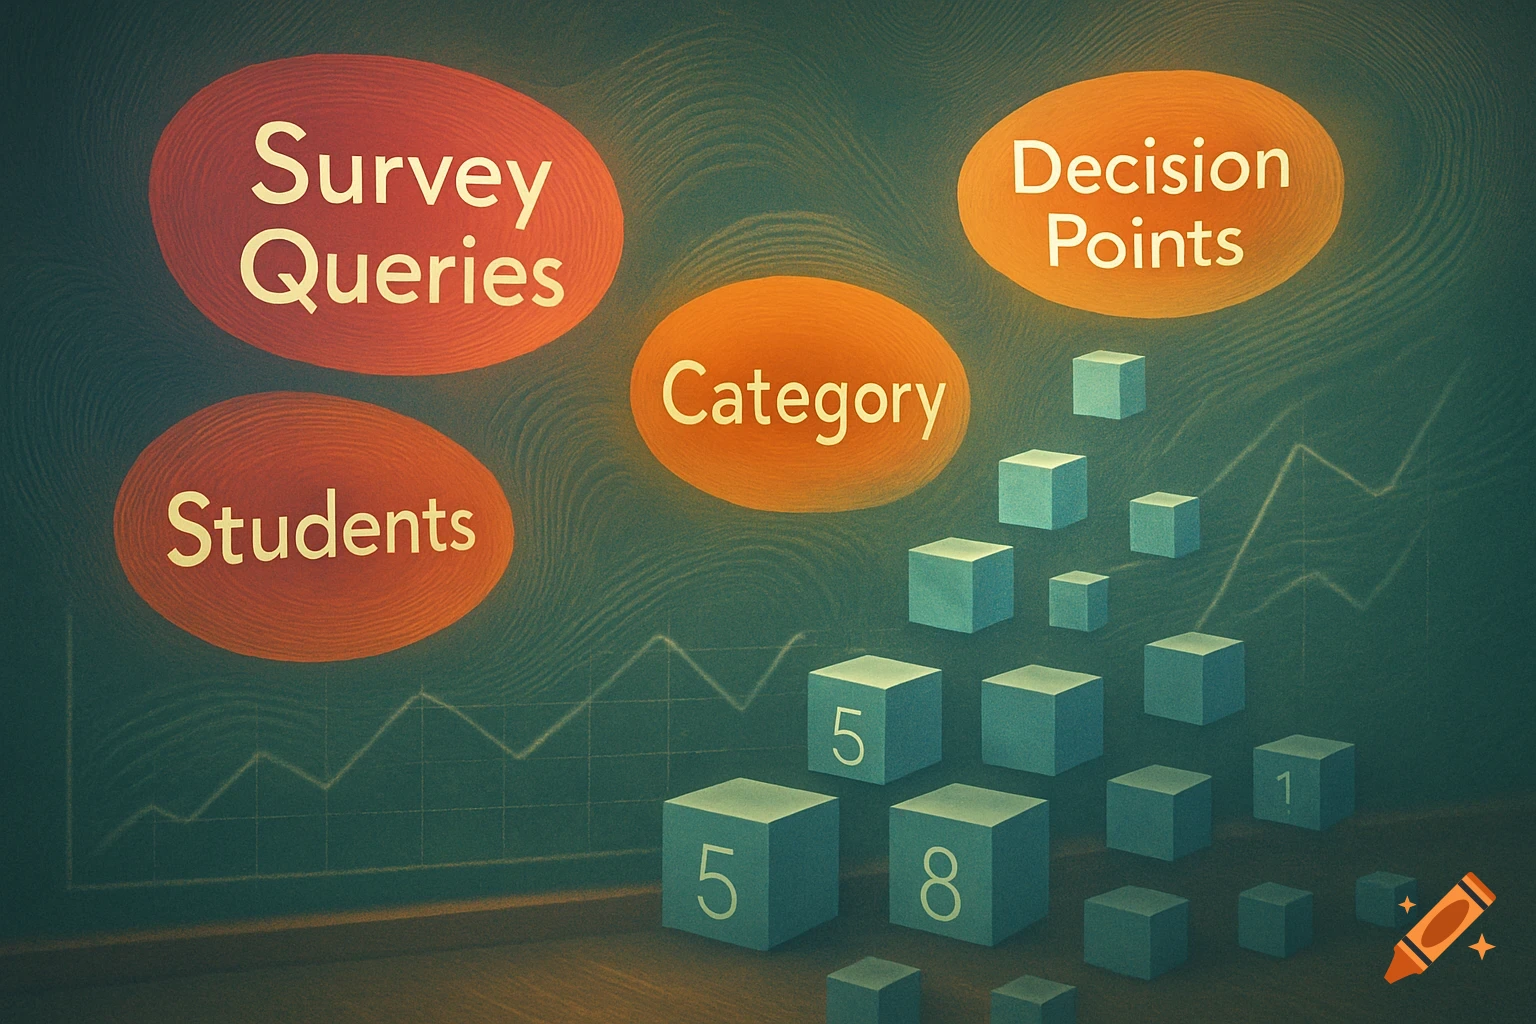
An infographic comparing categorical and numerical data. Categorical shows color swatches, animal silhouettes (dog, cat, rabbit), and 'YES/NO' buttons. Numerical shows a bar chart, a bell curve, and growing figures with numbers 1, 5, 10, 20.
Categorical data are labels or groups (favorite color, type of pet, yes/no answers). Numerical data are numbers you can measure or count (ages, test scores, number of books). See more