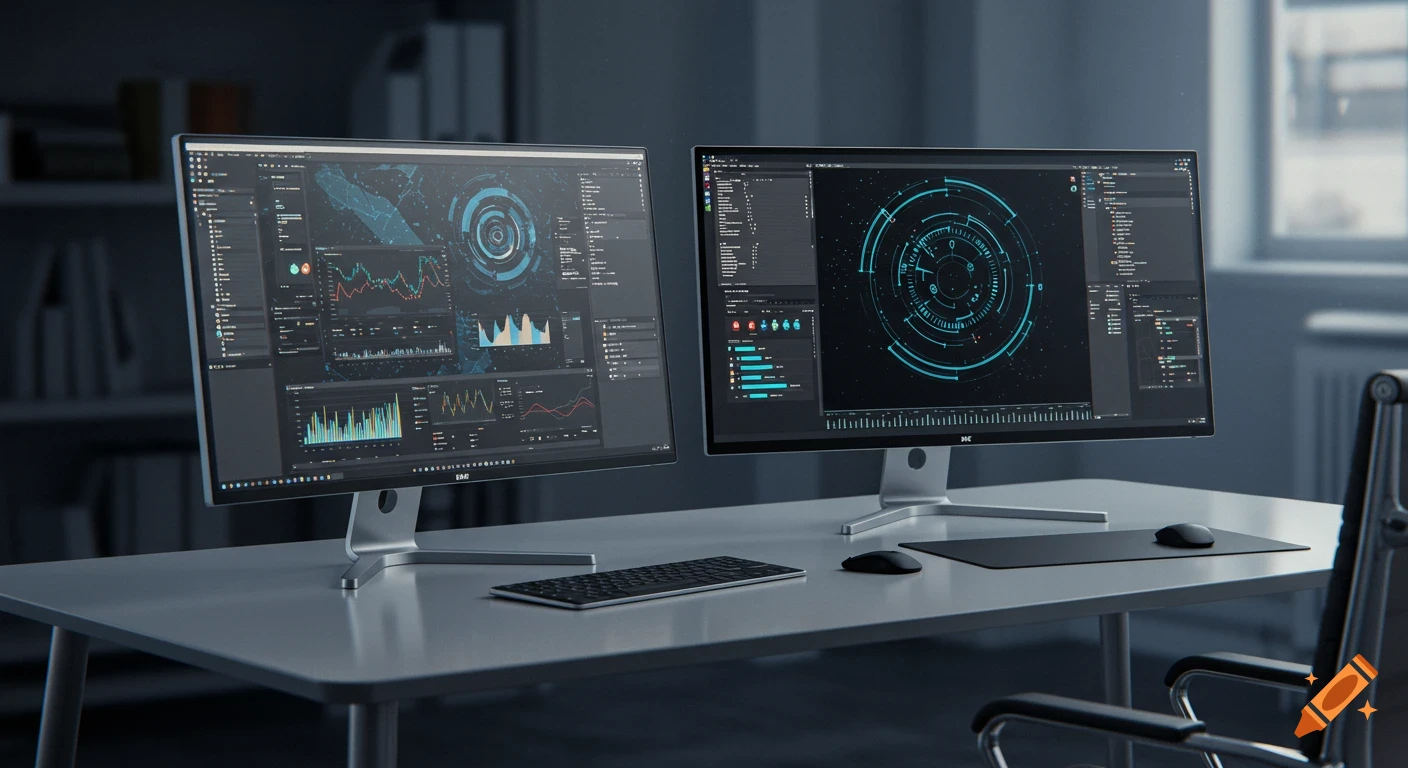
A split-screen visualization comparing two factory dashboards. The left is a simple operator dashboard with large text and icons. The right is a dense management dashboard with multiple small charts and metrics.
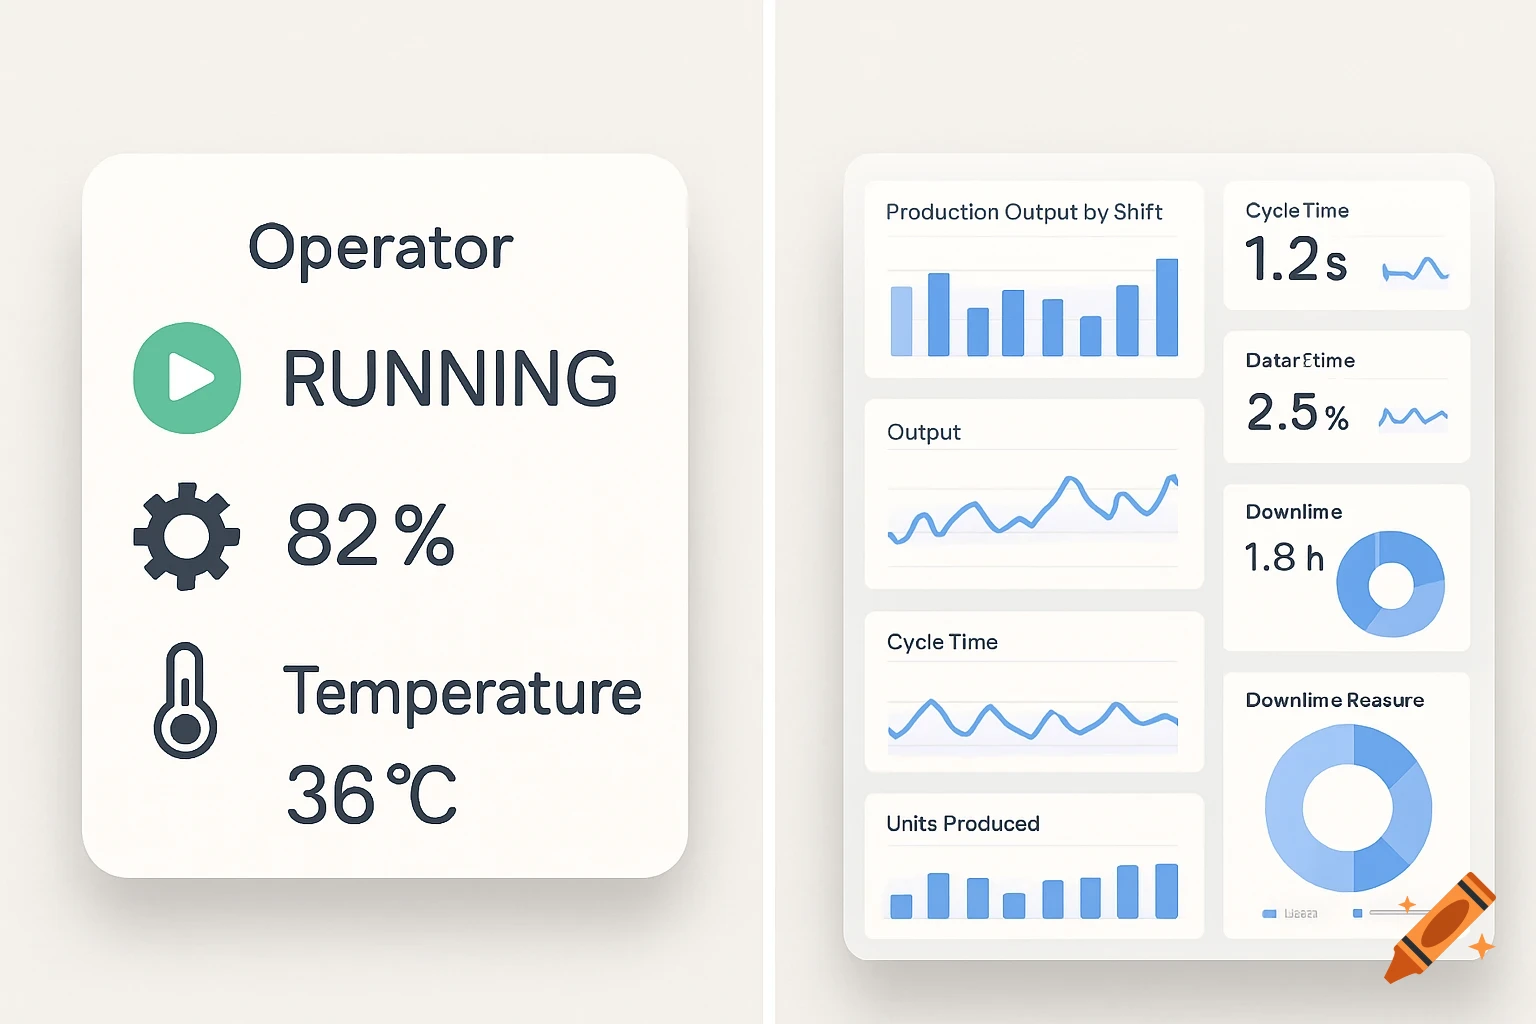
Create a single split-screen visualization comparing two factory dashboards that at first glance look similar but differ in cognitive complexity. Both sides should share the same light, neutral background and color palette. Left side: a simple operator dashboard with large icons, few metrics, and English labels such as “Line Status: RUNNING”, “Output: 82%”, “Temperature: 36°C”. Clear spacing, minimal text. Right side: a denser management dashboard with many panels, small charts, detailed English labels such as “Production Output by Shift”, “Cycle Time”, “Defect Rate”, “Downtime Reasons”. Keep both sides visually cohesive in tone, but vary information density and layout complexity rather than color. Lighting bright, clean, professional, optimized for a presentation background. See more