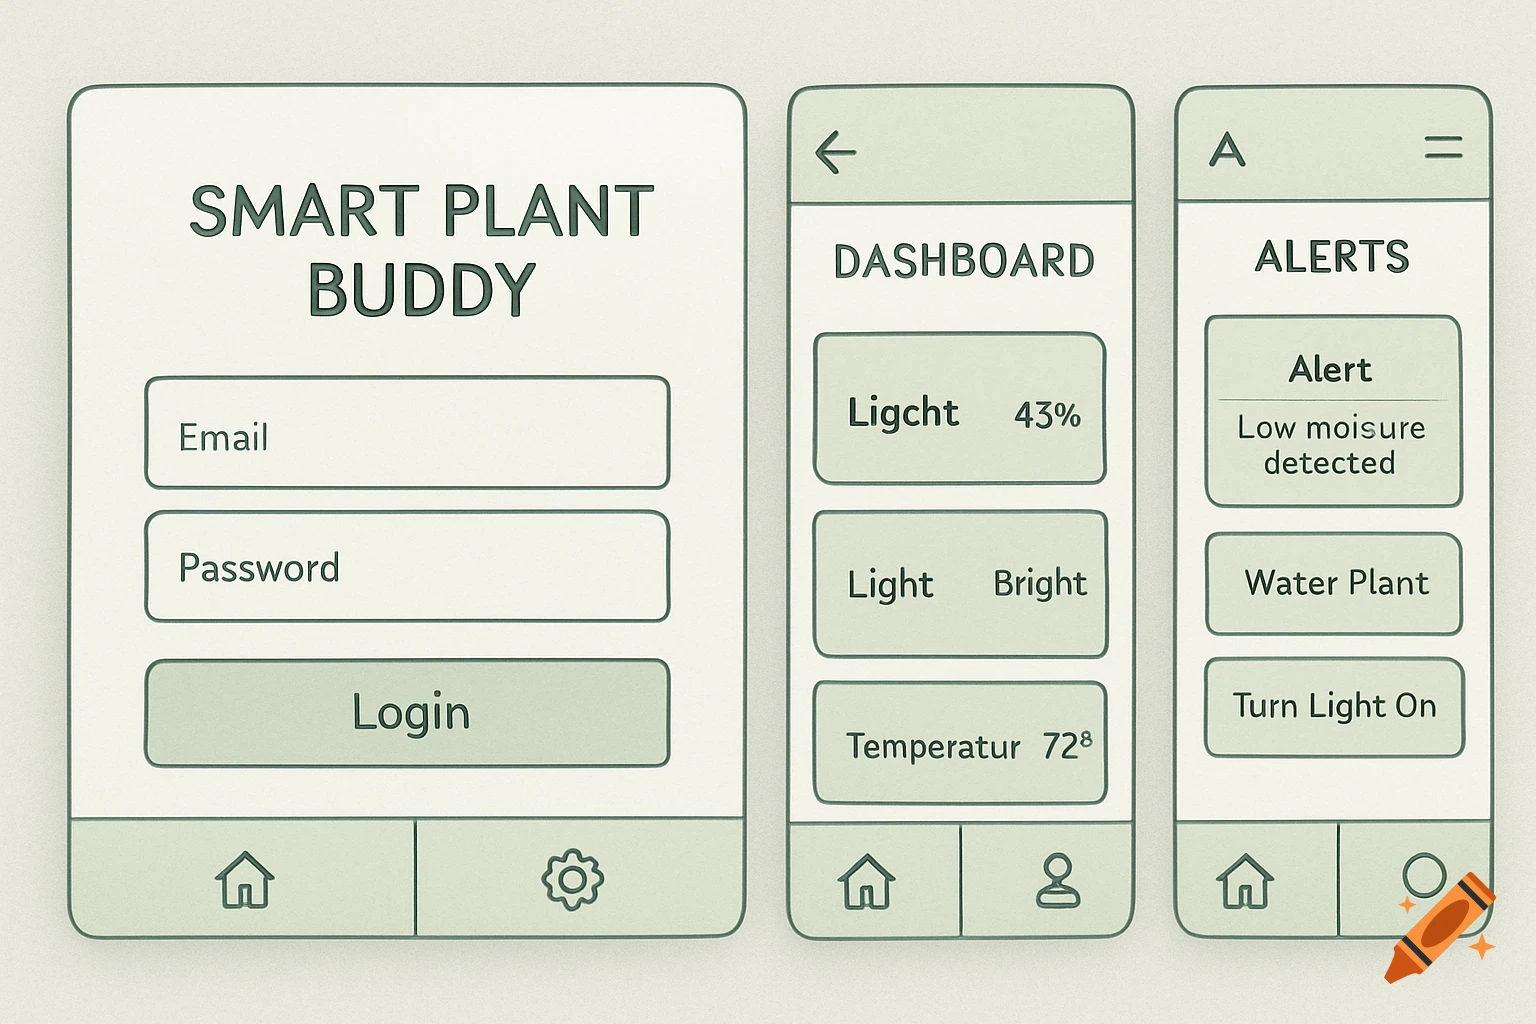
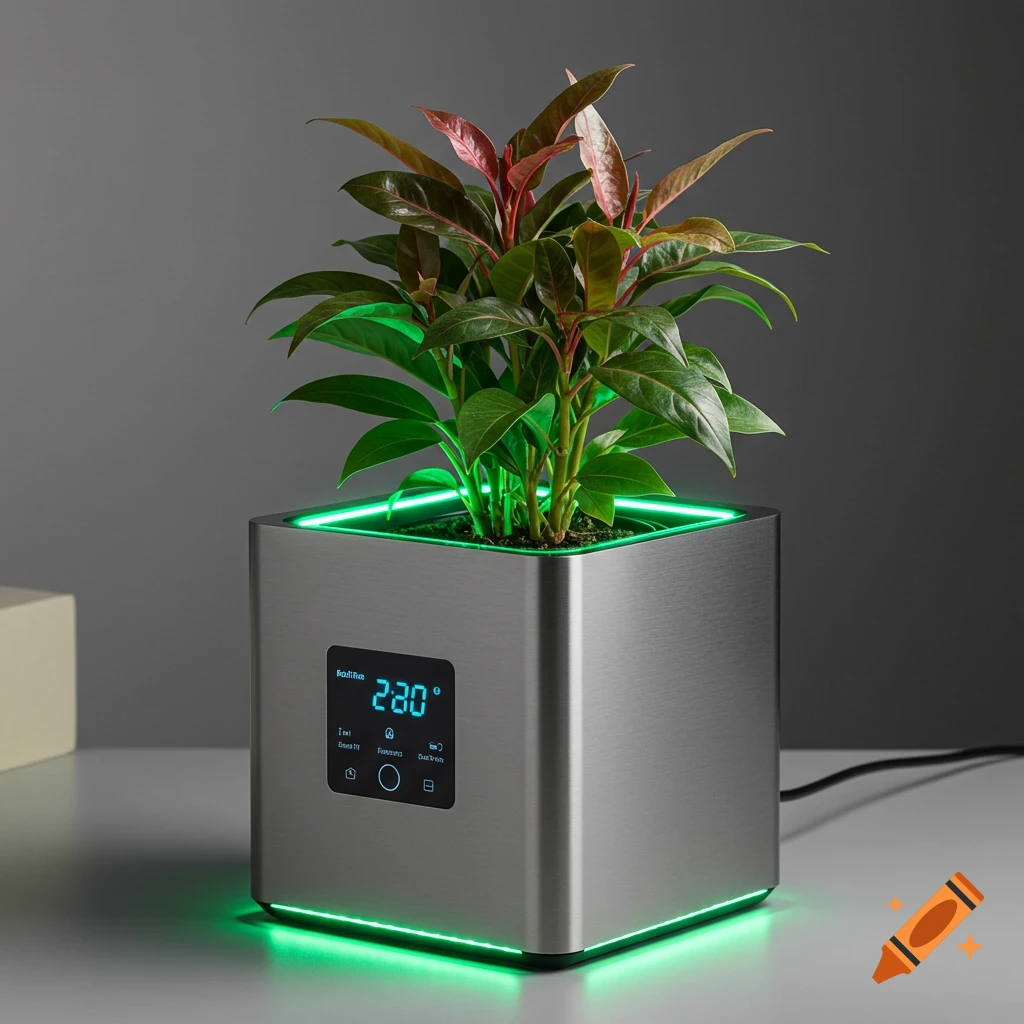
Two greyscale UI wireframes for a smart plant app. One shows a moisture level graph and average temperature. The other shows alert and control settings for a water pump, lights, and notifications.
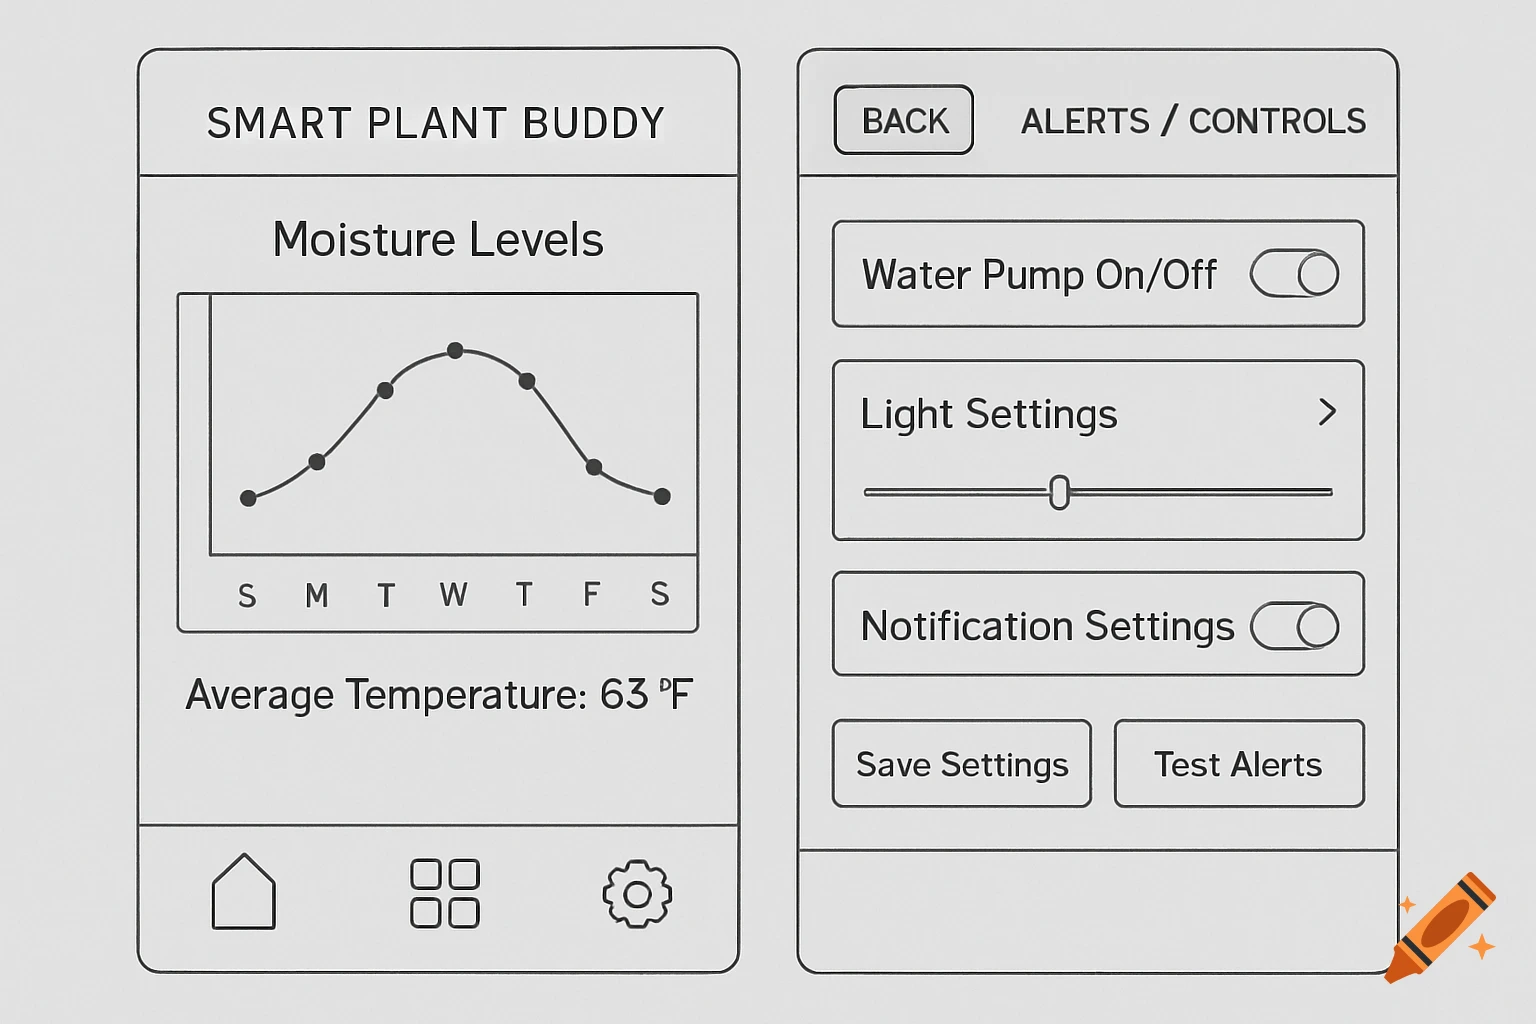
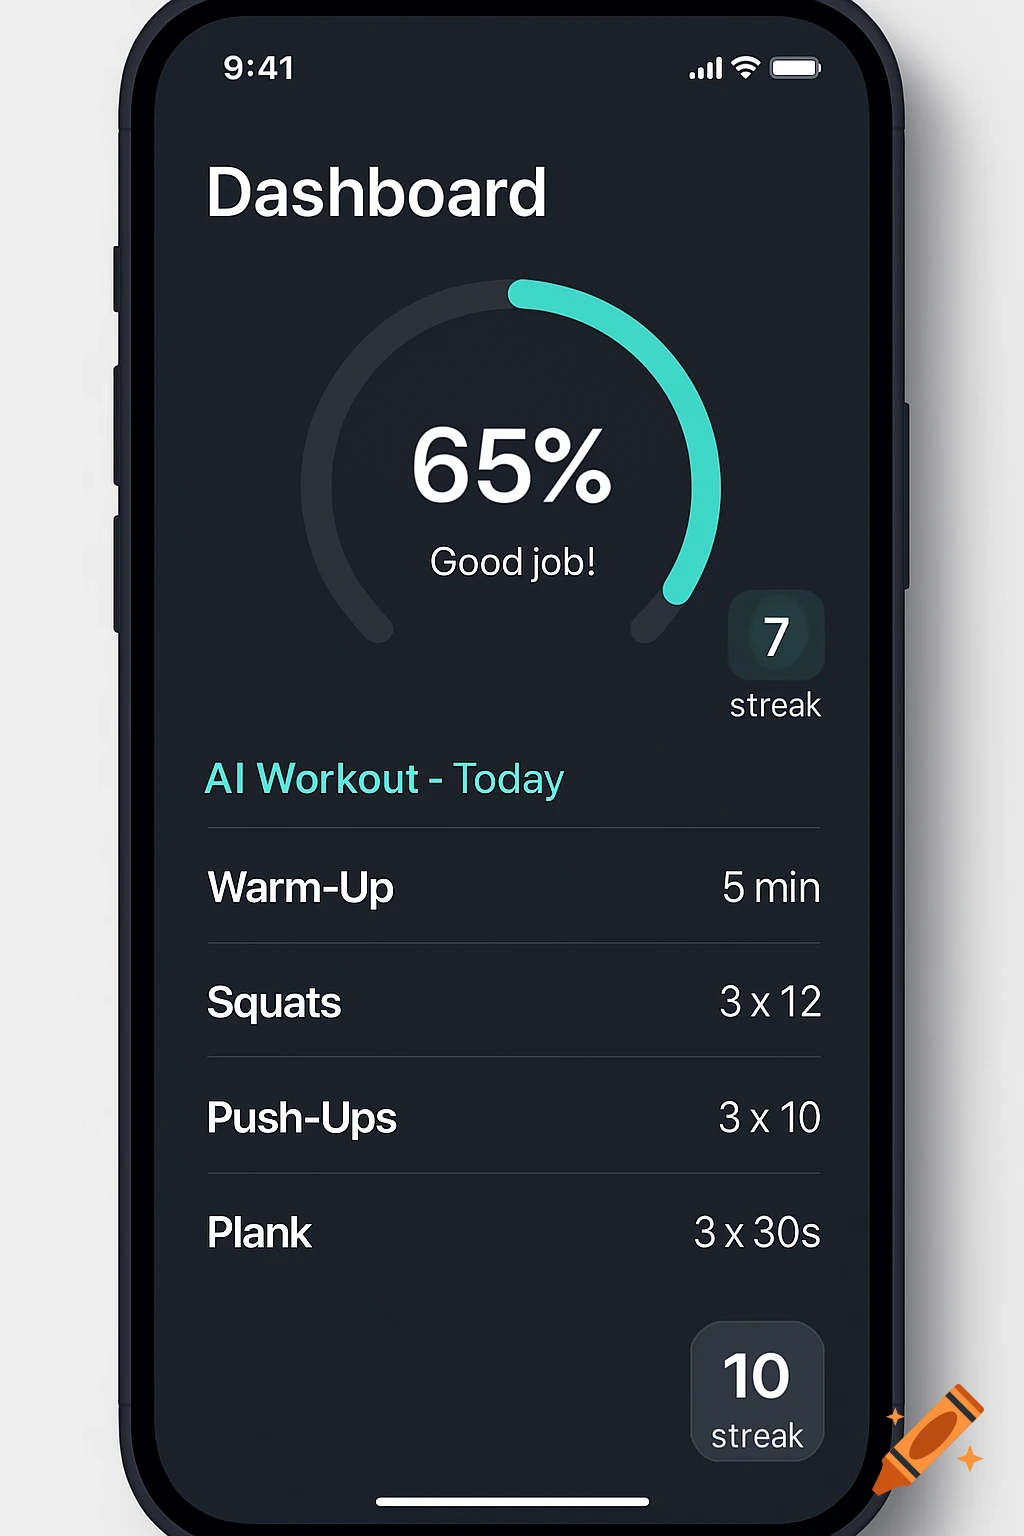
Create 4 separate "pages" (like slides) for key screens: Login, Dashboard, History, Alerts/Controls. Use basic shapes: Rectangles for buttons/screens, lines for navigation, text labels. Label everything clearly (e.g., "Moisture Gauge"). Export each as PNG/JPG, then insert into your Google Doc. If you hate drawing, use text descriptions (like below) and hand-draw on paper, photo it, and insert. Our 4 Key Screens: Focus on user flow: Login → Dashboard → History → Controls/Alerts. Copy-Paste This for Descriptions (Use as Guide): If you can't draw right away, paste these into your doc as placeholders, then replace with images. UI Mockups (Wireframes) Note: These are low-fidelity wireframes created in draw.io. Each represents a key screen in the mobile app flow. Login Screen Top: App title "Smart Plant Buddy" (large text). Middle: Email input field, Password input field, "Login" button below. Bottom: Navigation bar with icons: Home (house), Settings (gear). (Simple vertical layout for quick access. Flow: Leads to Dashboard after login.) Dashboard Screen Top: Navigation bar with "Back" arrow and "Logout" button. Middle: Large circle gauge labeled "Soil Moisture: 45%" (with color-coded low/medium/high zones). Below: Text "Current Temp: 72°F". Bottom: "View History" button and "Water Now" button. (Central focus on real-time data for at-a-glance checks.) History Screen Top: Navigation bar with "Dashboard" link. Middle: Line chart labeled "Moisture Over Past 7 Days" (x-axis: dates, See more