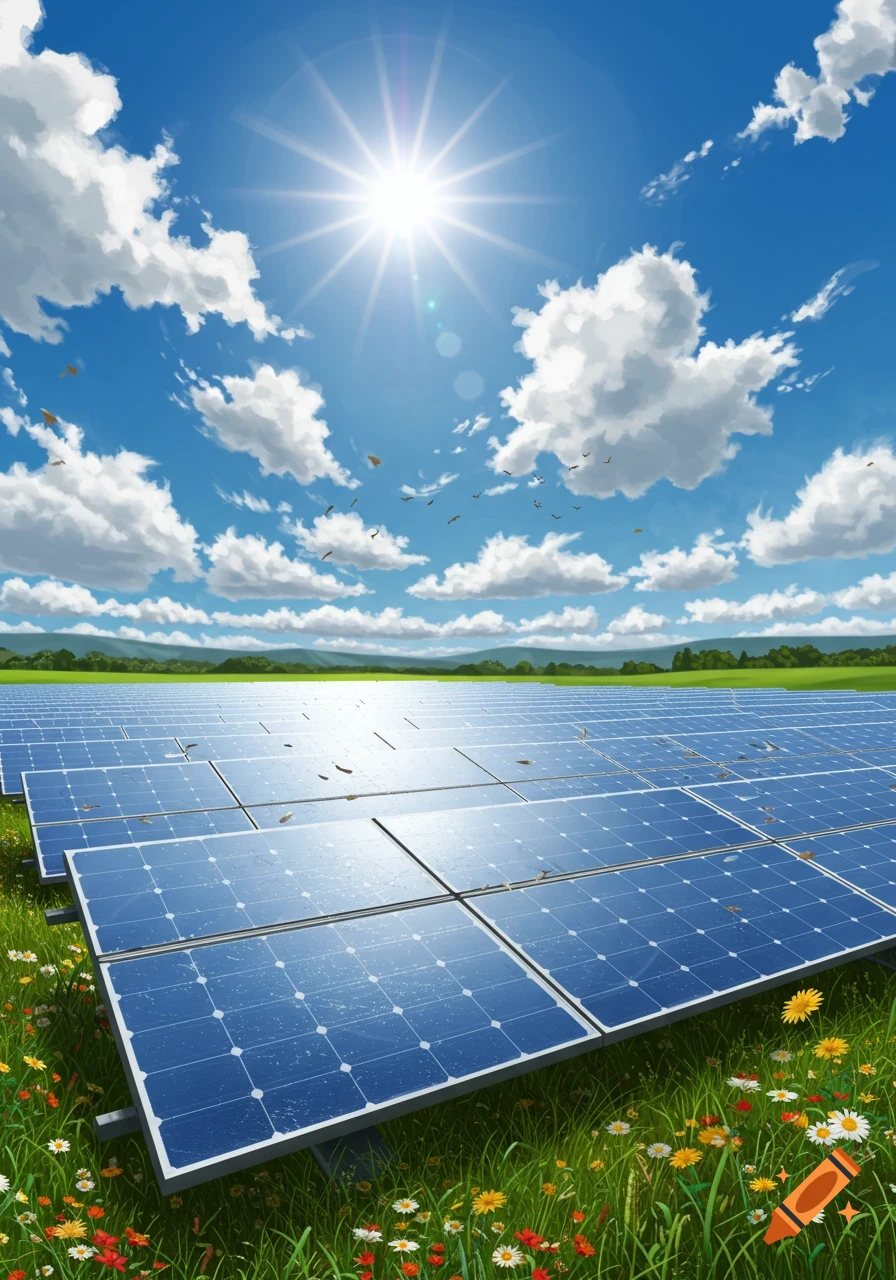
A minimalist infographic shows a sun, solar panel, and battery, with an arrow labeled "Daytime" pointing towards "Op" and home appliances.
Prompt for a Visual Asset (as described for the GIFs): "Create two infographic-style images for a GIF comparison. Image 1: Current Household Electricity Usage at 25p Scene: A split view or flow diagram. Left Element: A modern digital electricity meter, clearly visible. Right Element: A simplified interior of a house showing common appliances (e.g., TV, refrigerator, washing machine, laptop). Flow: A clear, prominent arrow originating from the electricity meter and pointing towards the household appliances. Text Overlay on Arrow: Clearly display "25p" in a legible font next to the arrow, indicating the cost from the grid. Overall Style: Clean, minimalist infographic style with a focus on clarity. Use a neutral color palette. Image 2: Off-Peak Charging & Free Daytime Usage Scene: A split view or flow diagram, matching the style and layout of Image 1 as closely as possible for consistency. Left Element: The same modern digital electricity meter as in Image 1. Middle Element: A sleek, modern home battery storage unit (e.g., a wall-mounted powerwall type unit). Right Element: The same simplified interior of a house with common appliances as in Image 1. Flow 1 (Charging): An arrow originating from the electricity meter and pointing towards the battery storage unit. Text Overlay on Charging Arrow: Clearly display "7p" in a legible font next to this arrow, indicating the off-peak charging cost. Flow 2 (Usage): A second distinct arrow originating from the battery storage unit and See more