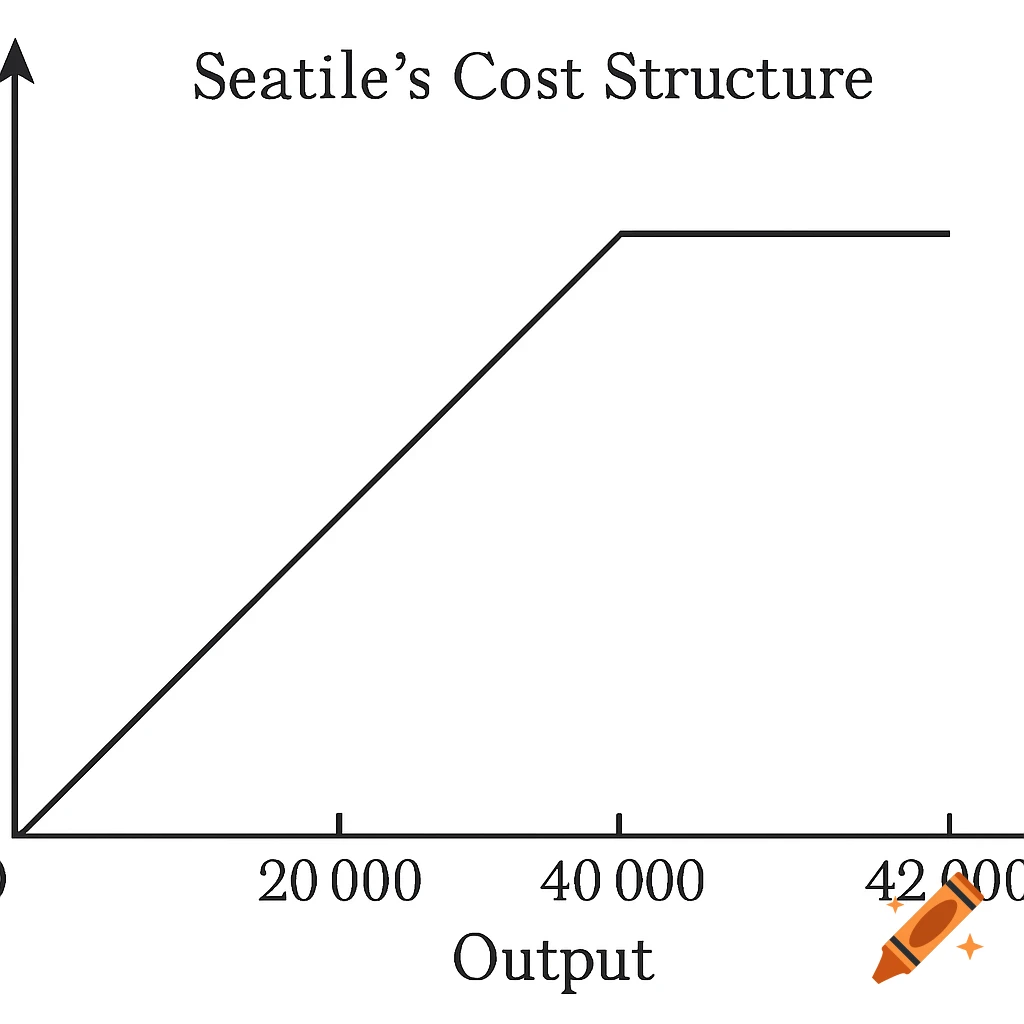
A black and white line graph titled "Seatiles's Cost Structure" showing output on the x-axis, with values 20,000, 40,000, and 42,000. The graph rises linearly from the origin to 40,000 then flattens.
Sketch a graph to model Seattle’s cost structure over the domain [0, 42000]. Be sure to label the axes and any endpoints where the graph breaks. See more