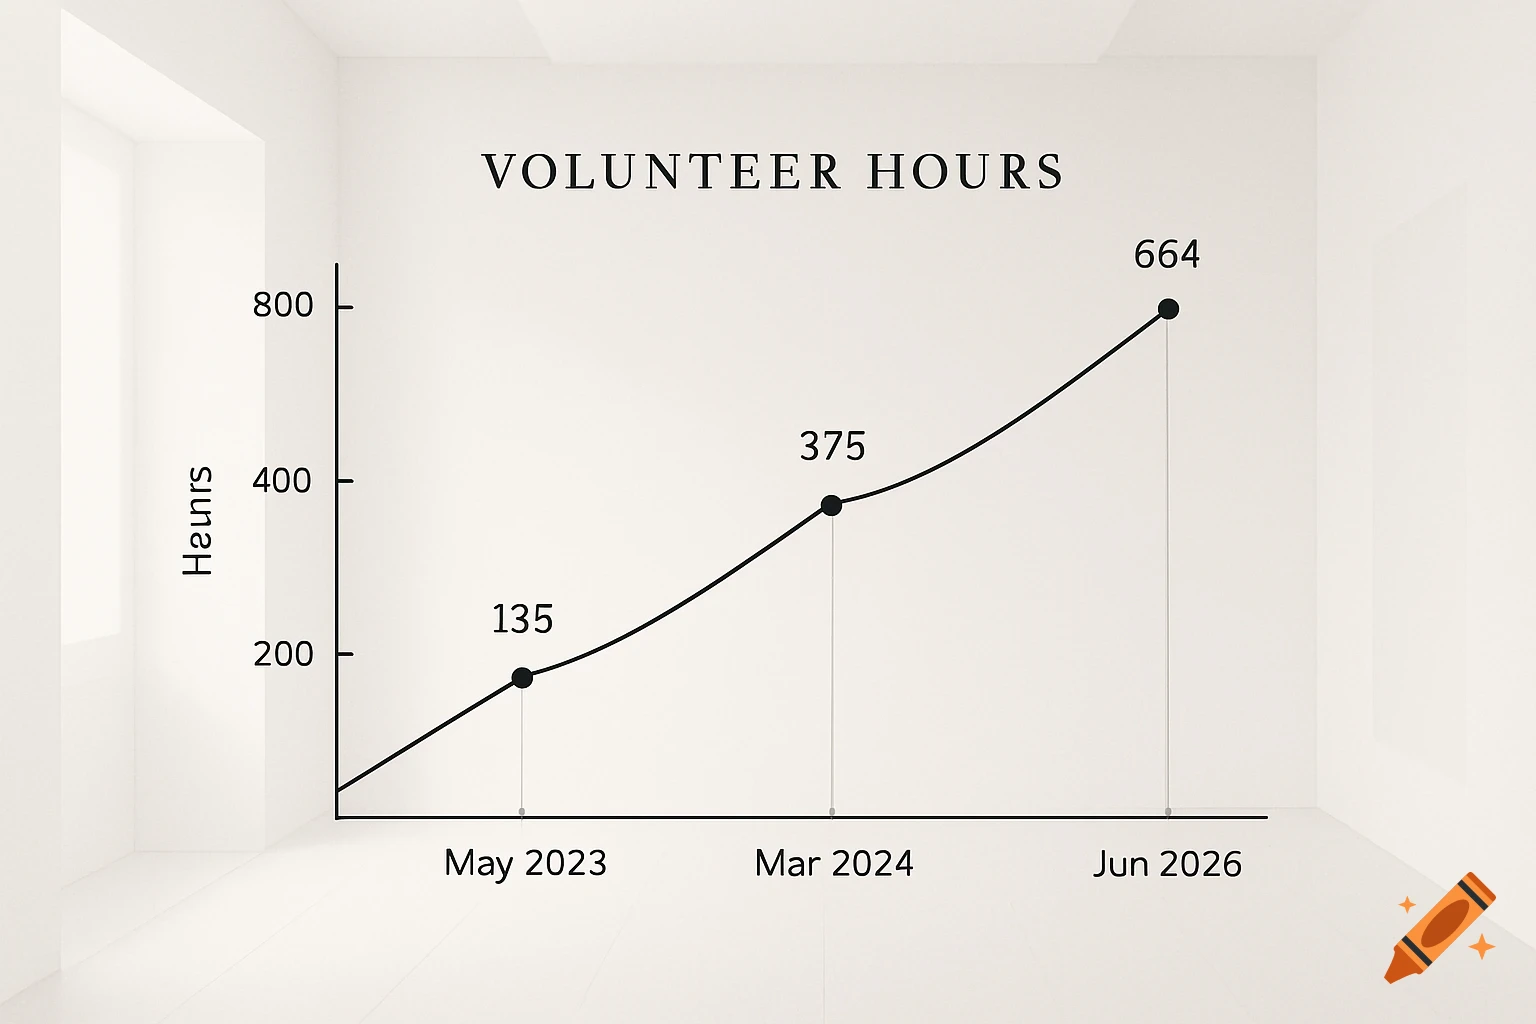
A minimalist black and white line graph titled 'Volunteer Hours' showing an upward trend, with points marked at 135 in Feb, 375 in Apr, and 664 in Jun 2025.
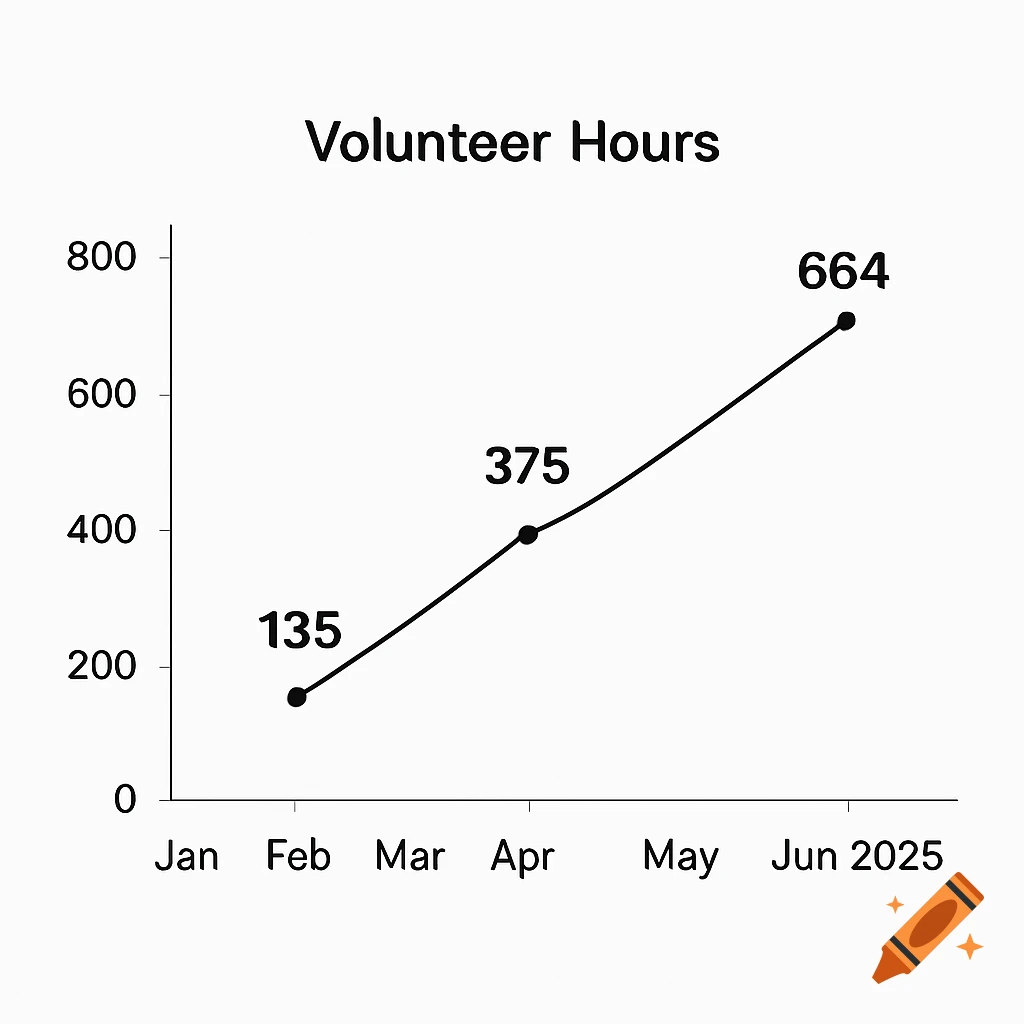
Create a minimalist line graph showing volunteer hours over time. The background should be white with no clutter. The graph should have labeled axes: the horizontal axis labeled with abbreviated months and years ("Jan," "Feb," "Mar," ..., "Jun 2025") and the vertical axis labeled with hours ("0," "200," "400," "600," "800"). The line should show a clear upward trend from left to right, with data points at: 2023: 135 hours (around March 2023) 2024: 375 hours (around March 2024) June 2025: 664 hours Use a simple, thin black or dark gray line with small circular markers at each data point. Keep the overall style very clean, modern, and uncluttered, with no gridlines or unnecessary details. The labels should be in a sans-serif font, centered and easy to read. See more