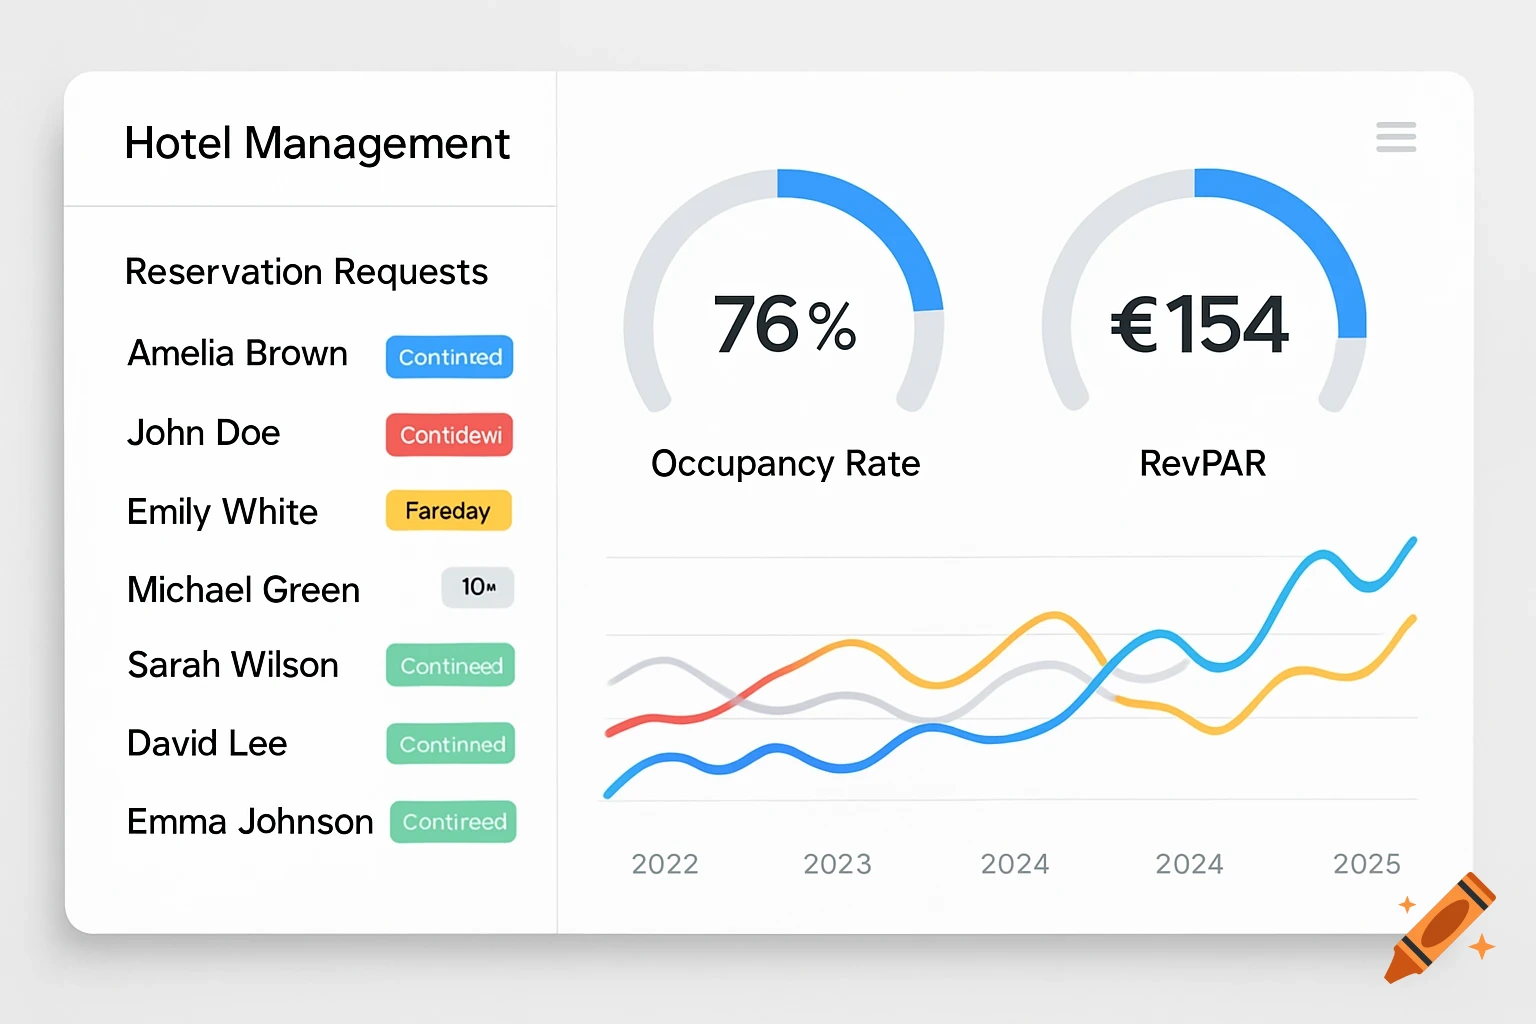
A user interface dashboard displaying analytics with KPI cards, line chart, Sankey chart, and combo chart.
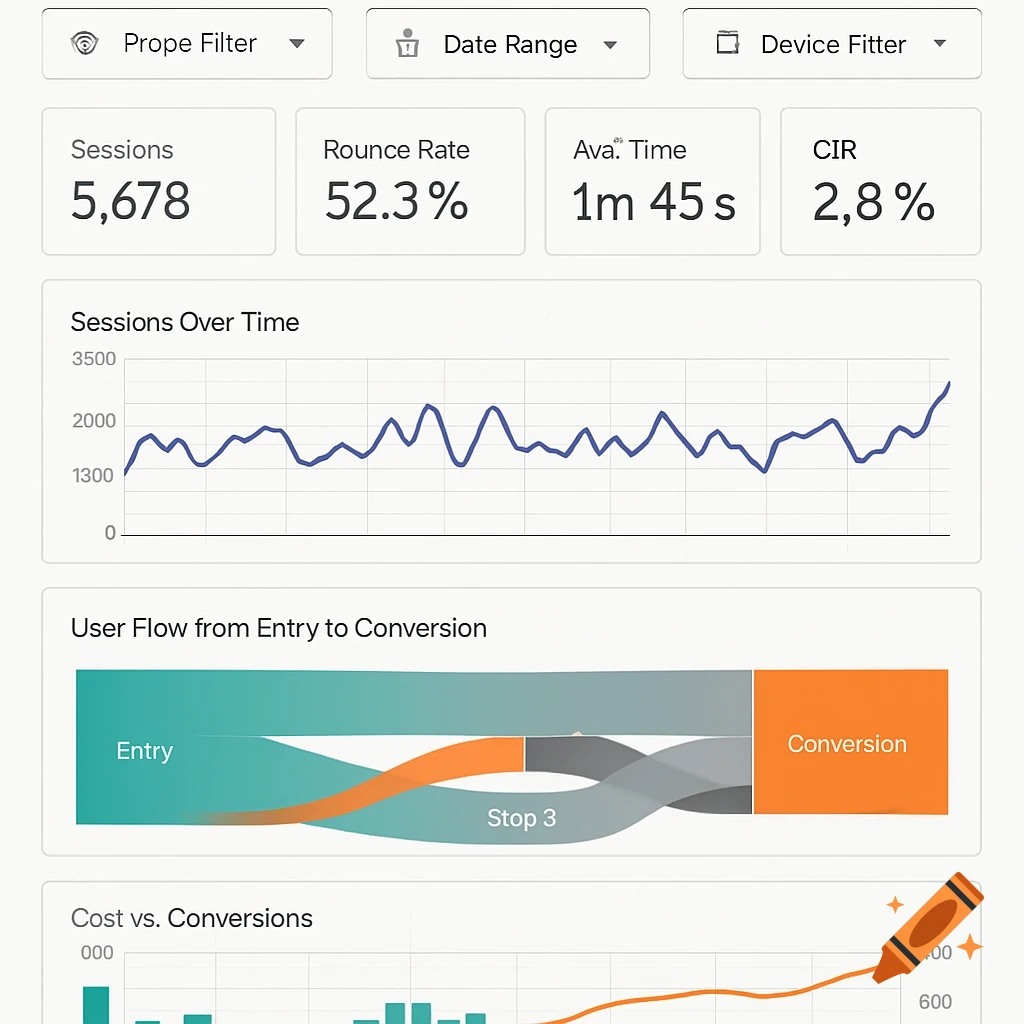
-------------------------------------------------------- | 🌍 Property Filter | 📅 Date Range | 📱 Device Filter | -------------------------------------------------------- | 🧠 KPI Cards: Sessions | Bounce Rate | Avg Time | CTR | -------------------------------------------------------- | 📈 Line Chart: Sessions Over Time | | [Indigo line] | -------------------------------------------------------- | 🔀 Sankey Chart: User Flow from Entry to Conversion | | [Flows: teal → orange → gray] | -------------------------------------------------------- | 📊 Combo Chart: Cost vs. Conversions | | [Bars = Cost (Teal), Line = Conversions (Orange)]| -------------------------------------------------------- See more