An infographic titled "Ferguson Zones and UV Index," showing four colored bars (green to red) representing different basking zones for lizards, corresponding to UV Index levels from 0 to 10. Each zone has a lizard illustration.
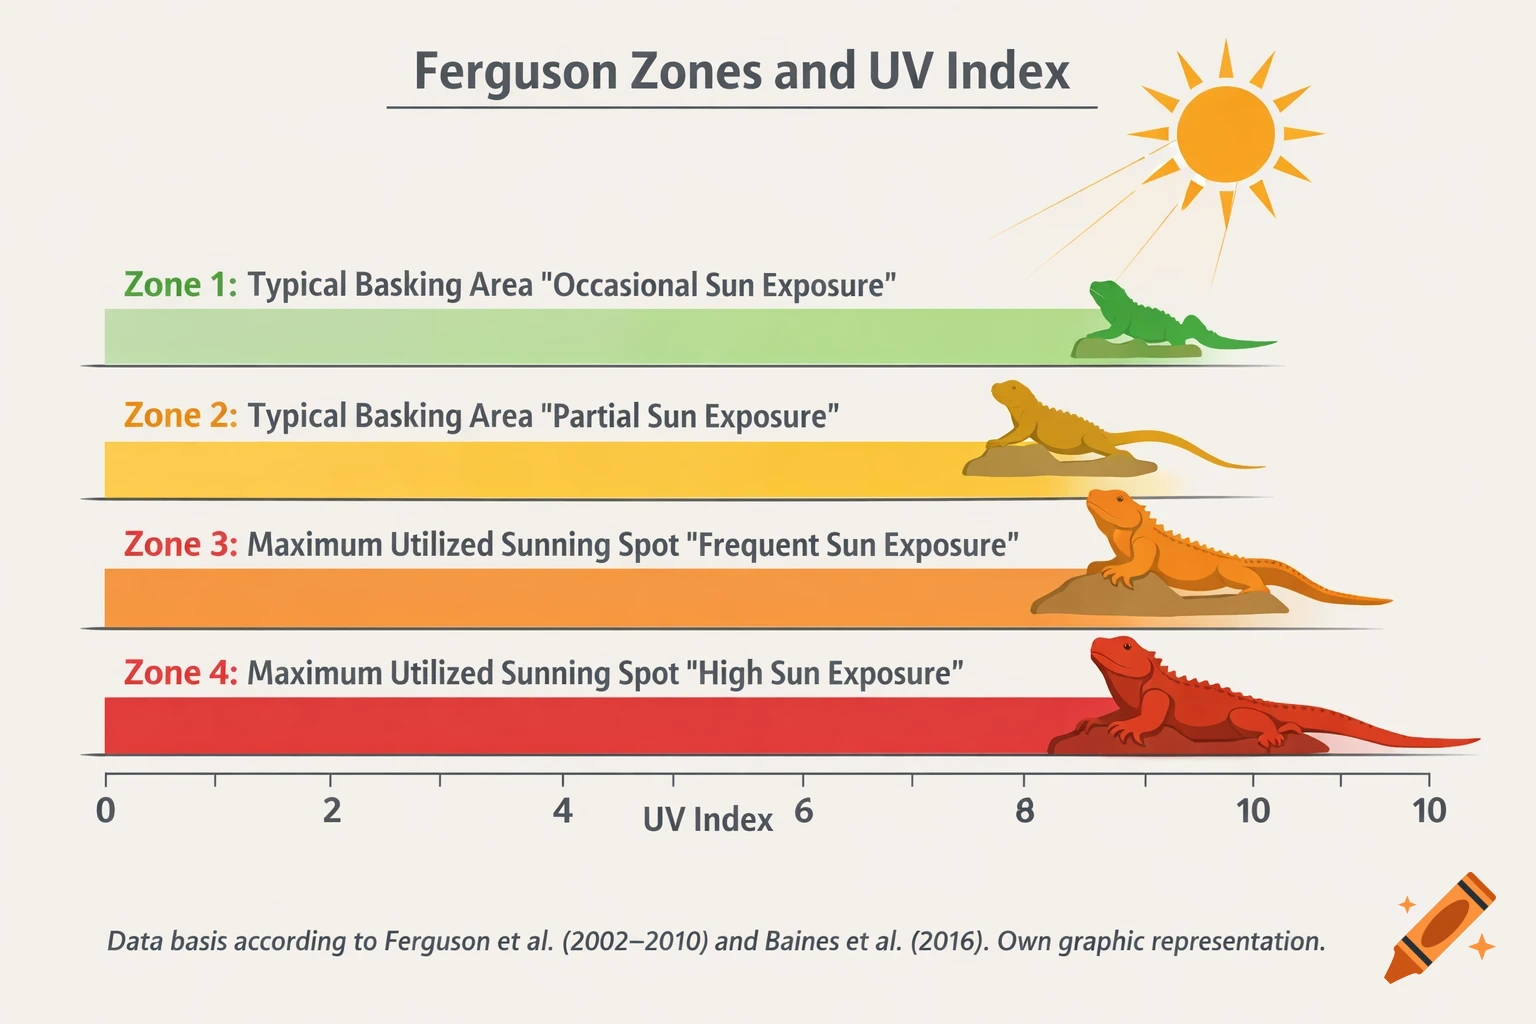
Abbildung 1: Ferguson-Zonen und UV-Index-Bereiche Titel (unter der Abbildung): Abbildung 1: Schematische Darstellung der Ferguson-Zonen mit typischen UV-Index-Bereichen und zugehörigem Sonnenverhalten von Reptilien. Inhalt (grafisch): • Horizontale Balkengrafik • X-Achse: UV-Index (0–10) • Vier farblich getrennte Balken: o Zone 1: sehr hellgrün o Zone 2: gelb o Zone 3: orange o Zone 4: rot • Kennzeichnung: o „typischer Aufenthaltsbereich“ o „maximal genutzter Sonnenplatz“ Quelle / Nachweis (Bildunterschrift klein): Datenbasis nach Ferguson et al. (2002–2010) und Baines et al. (2016). Eigene grafische Darstellung. Primärquelle: • Ferguson et al., Journal of Herpetology • Baines et al. 2016, Journal of Zoo and Aquarium Research See more