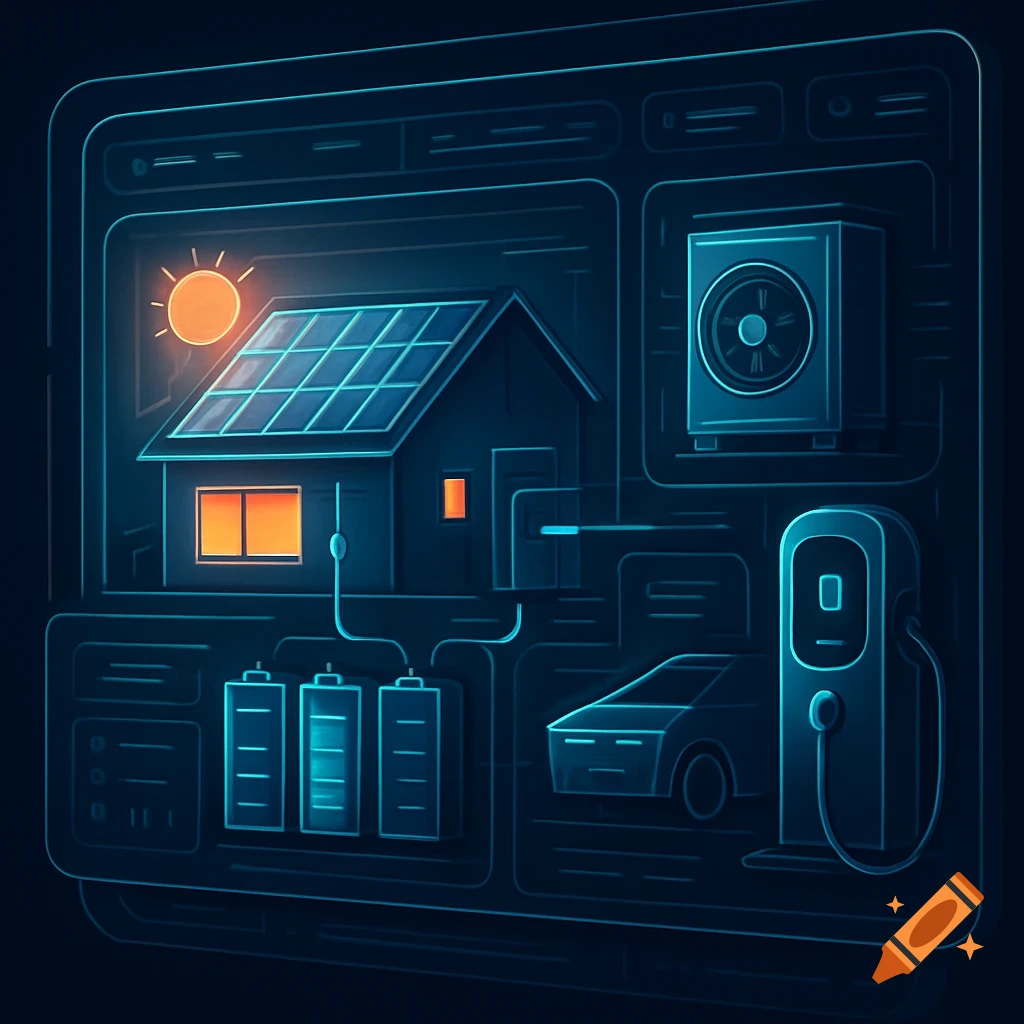
Infographic on energy consumption analysis of thermoelectric systems with icons and a line graph showing energy efficiency, power consumption, and heat loss.
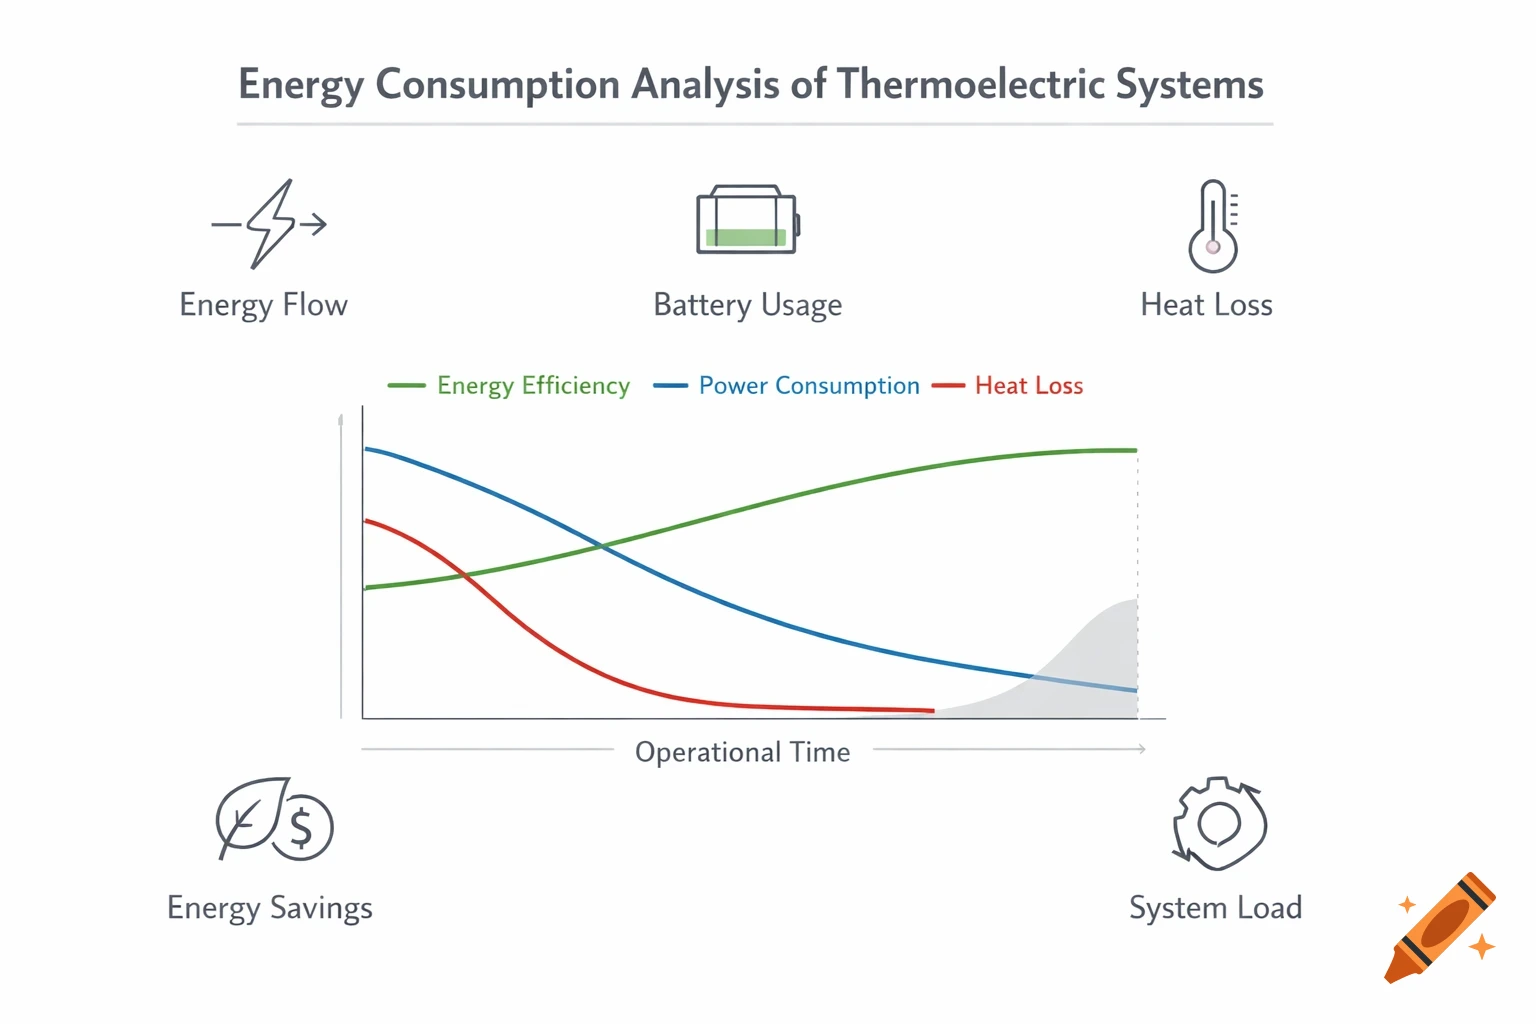
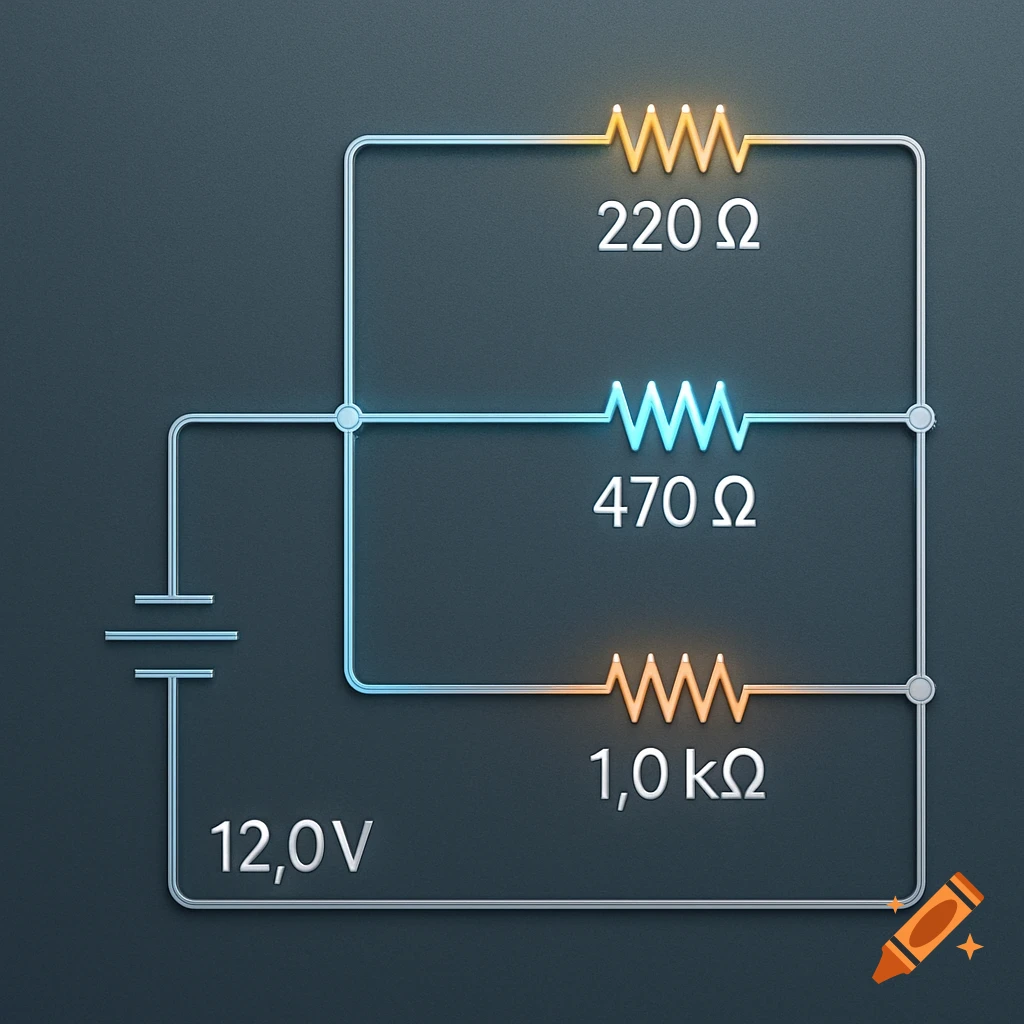
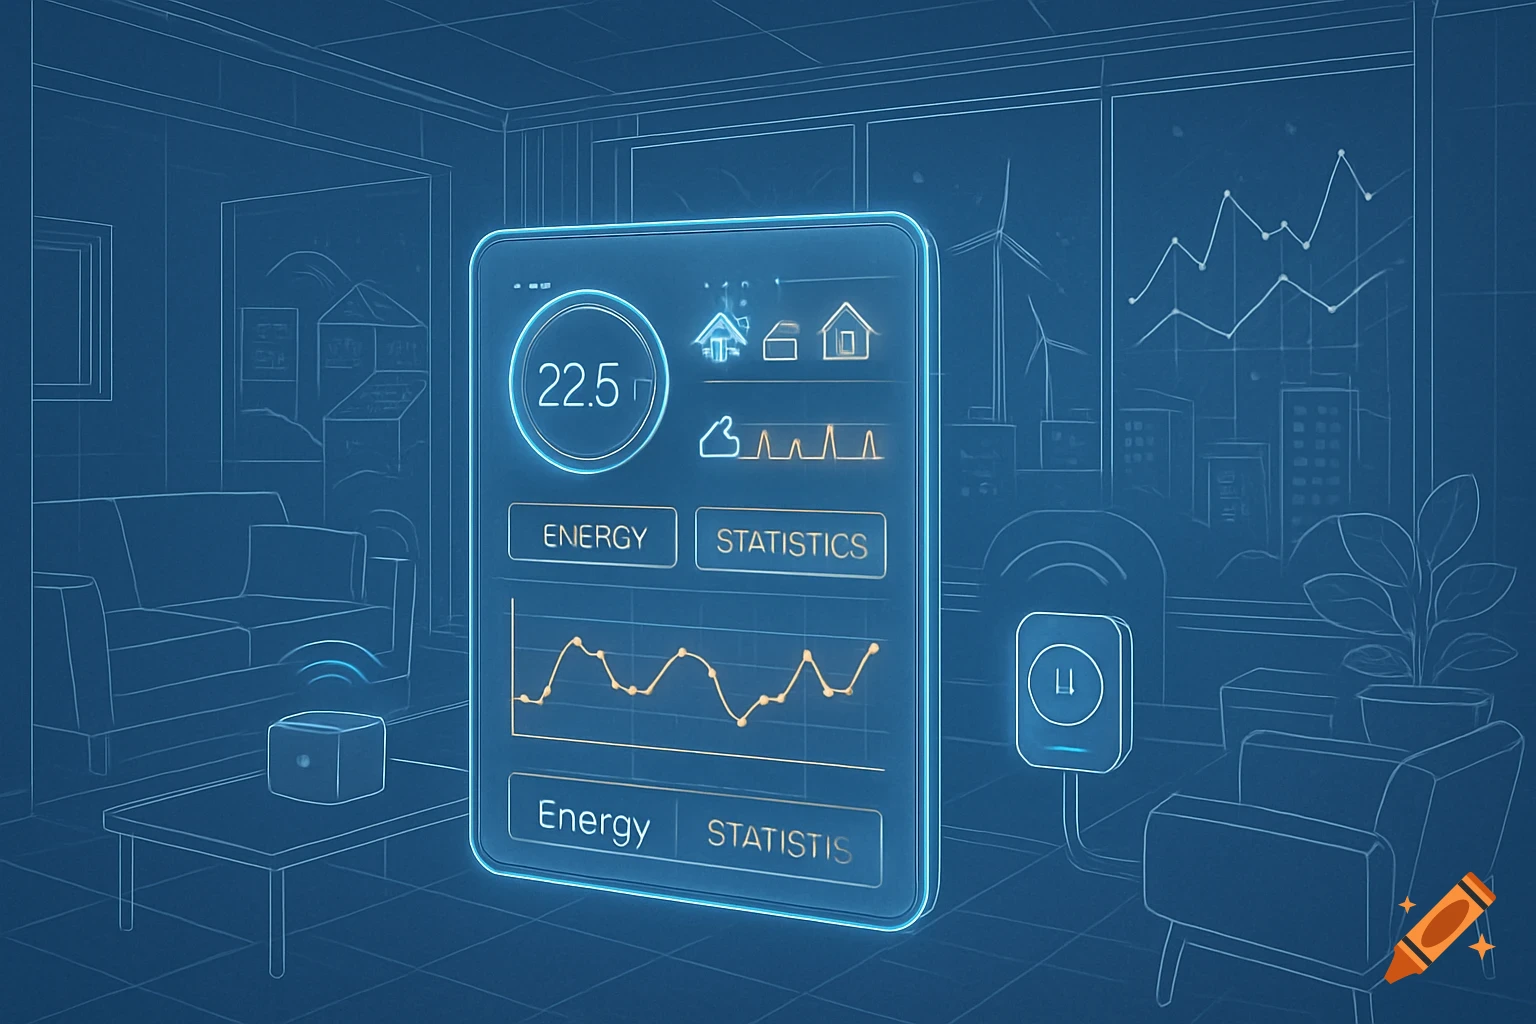
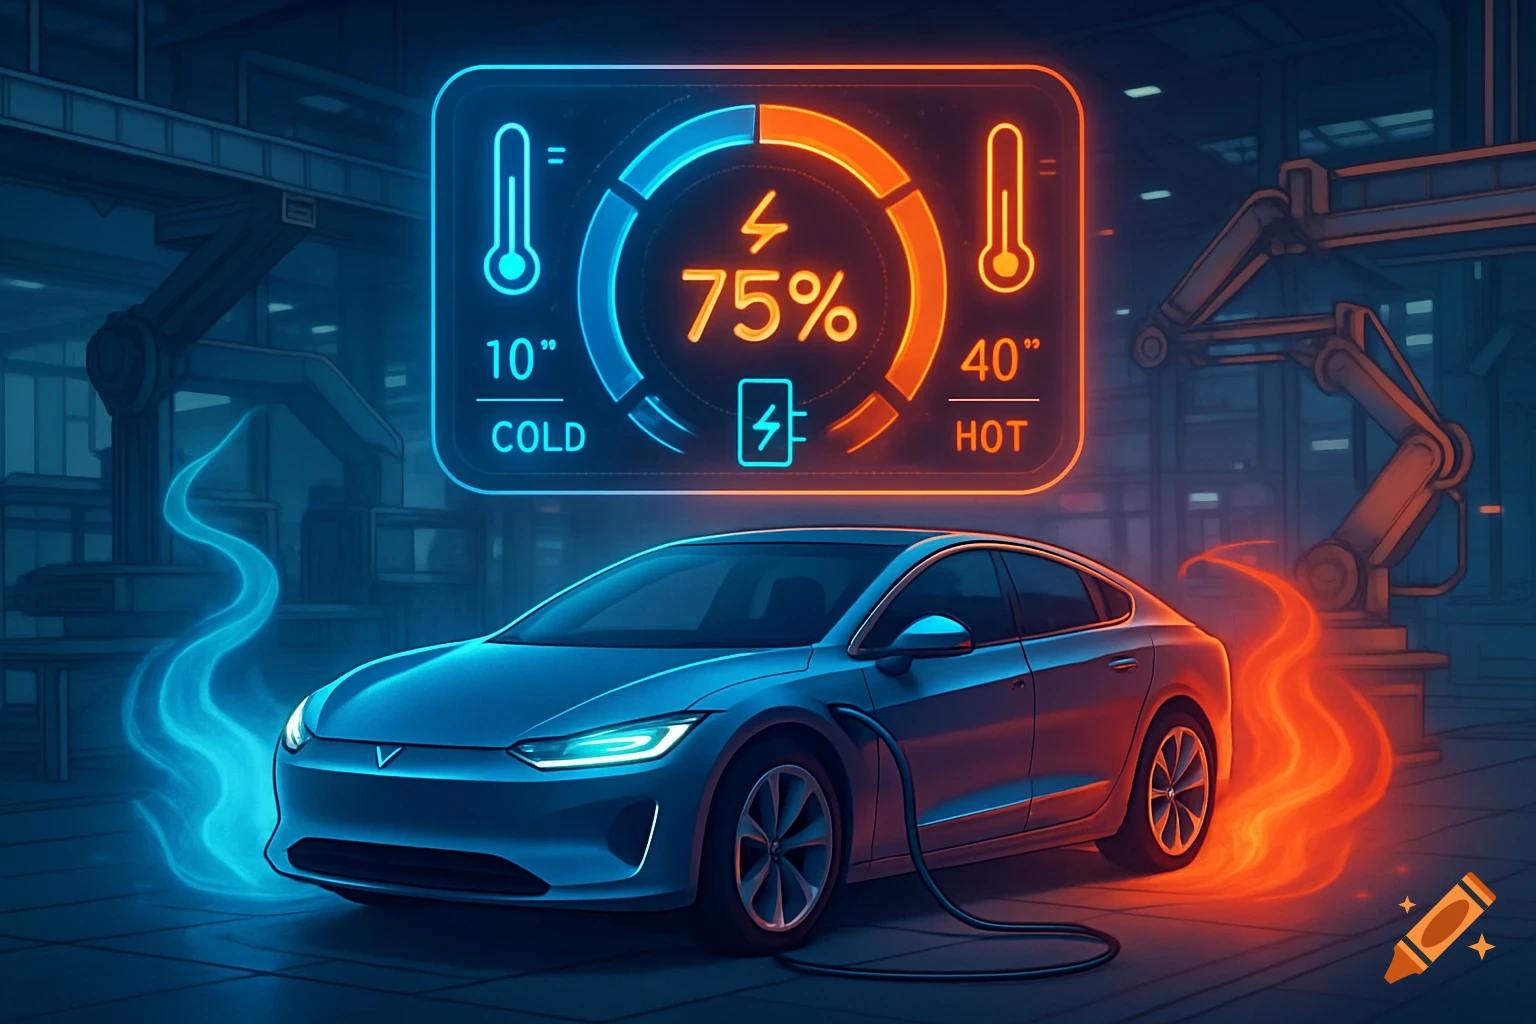
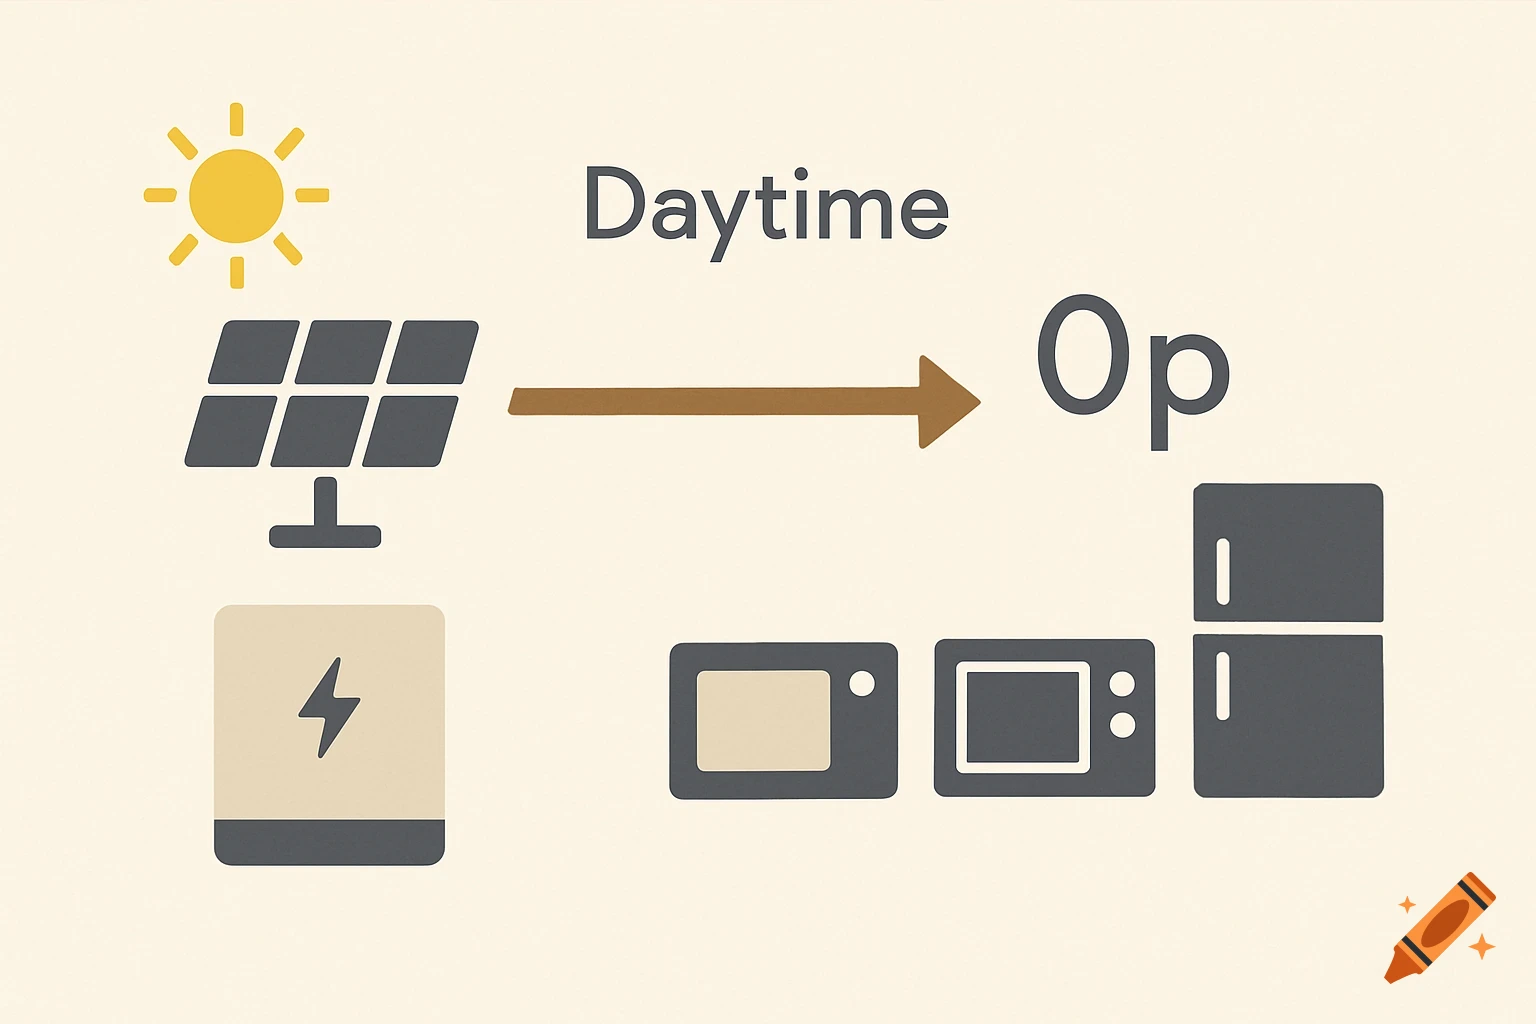
Create a clean, high-resolution infographic illustration for Energy Consumption Analysis of Thermoelectric Systems in automobiles. Use a pure white background and keep the design minimal and uncluttered. Include the following elements: - Simple line chart, bar chart, or pie chart showing energy consumption metrics. - Icons representing energy flow, battery usage, heat, or power efficiency. - Short, clear English labels for key points, such as: - Energy Efficiency - Power Consumption - Heat Loss - Operational Time - Energy Savings - System Load Maintain generous white space, clear alignment, and balanced layout. Use simple line icons or geometric shapes; avoid shadows, gradients, textures, or decorative elements. Ensure all text is perfectly readable and well-aligned. The overall style should be modern, minimal, professional, and suitable for technical presentations, university slides, or engineering reports. See more