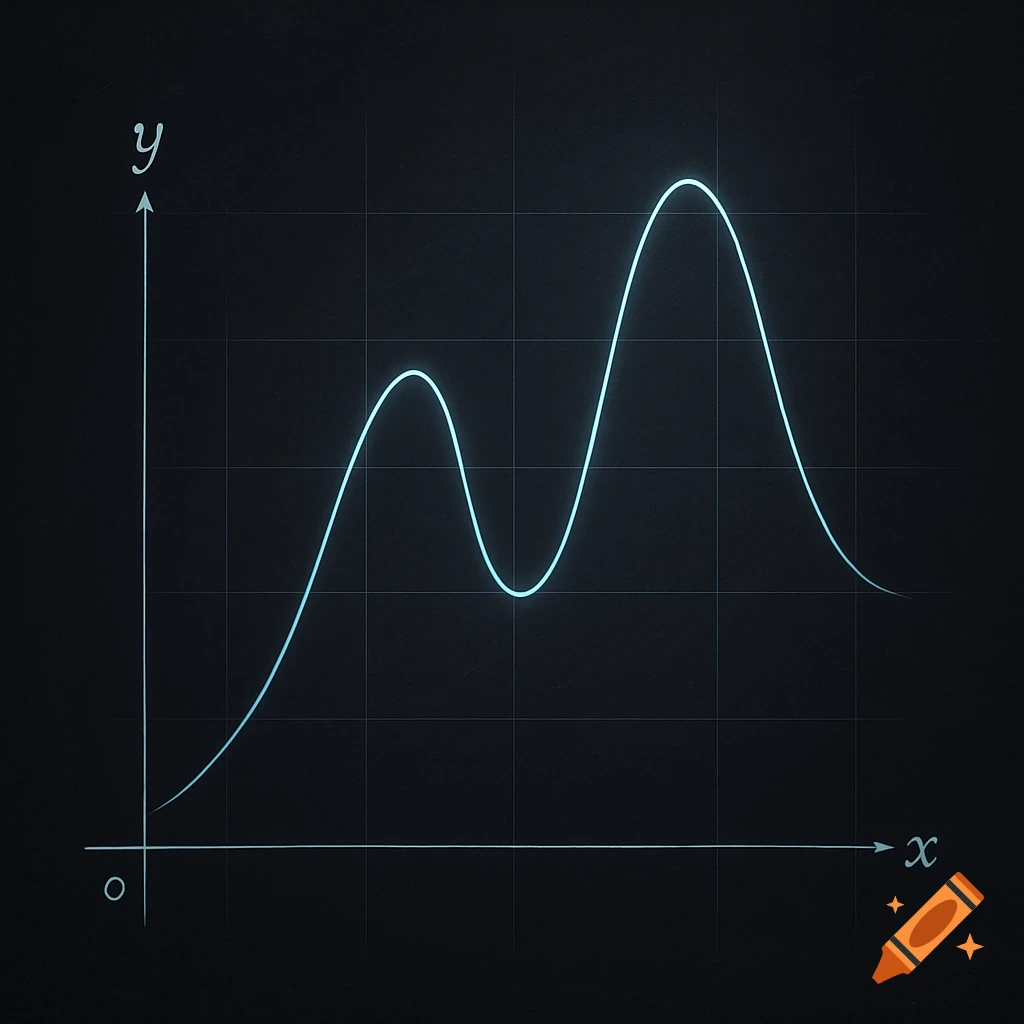
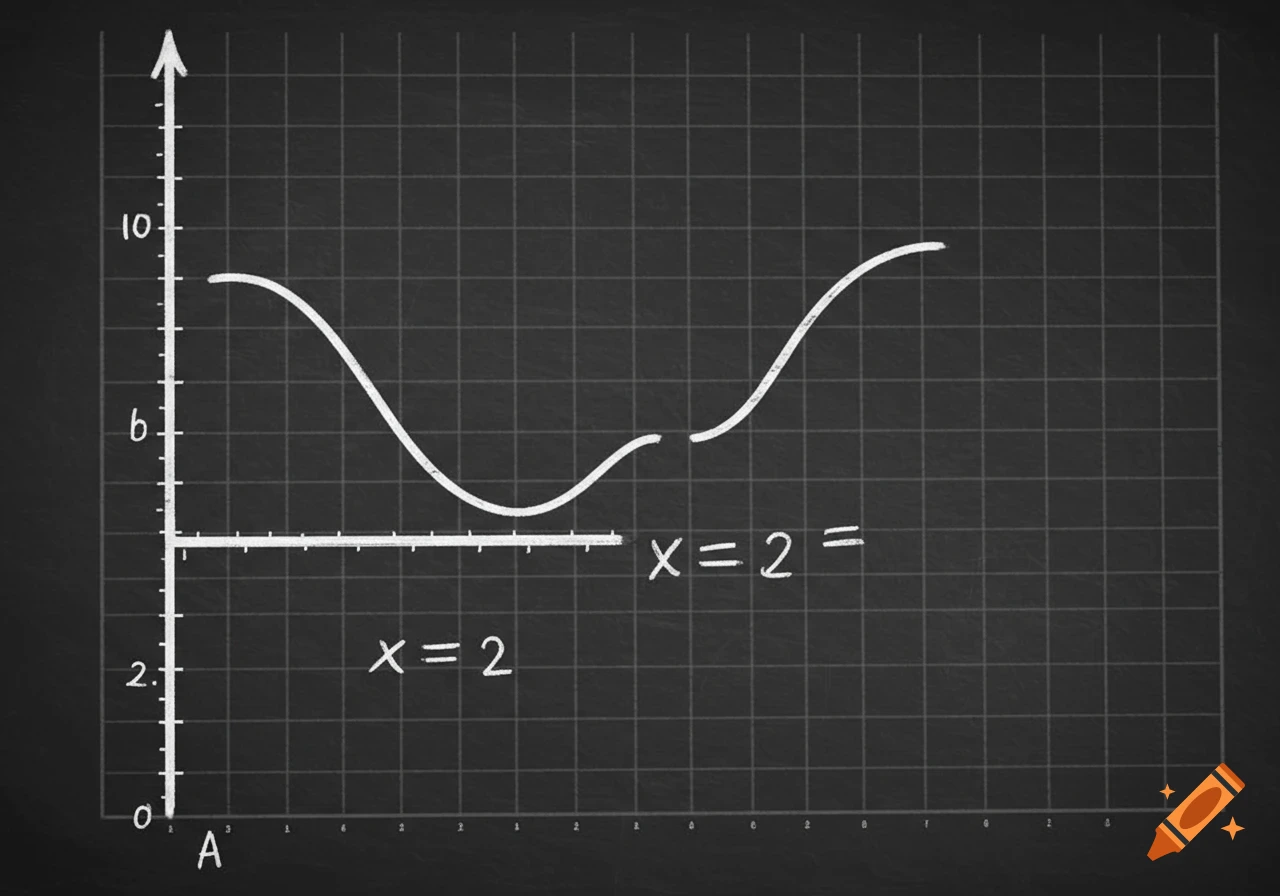
A hand-drawn speed vs. time graph for 1 lap, showing four segments labeled uphill, flat, and two downhill sections, with speed on the y-axis and time on the x-axis.
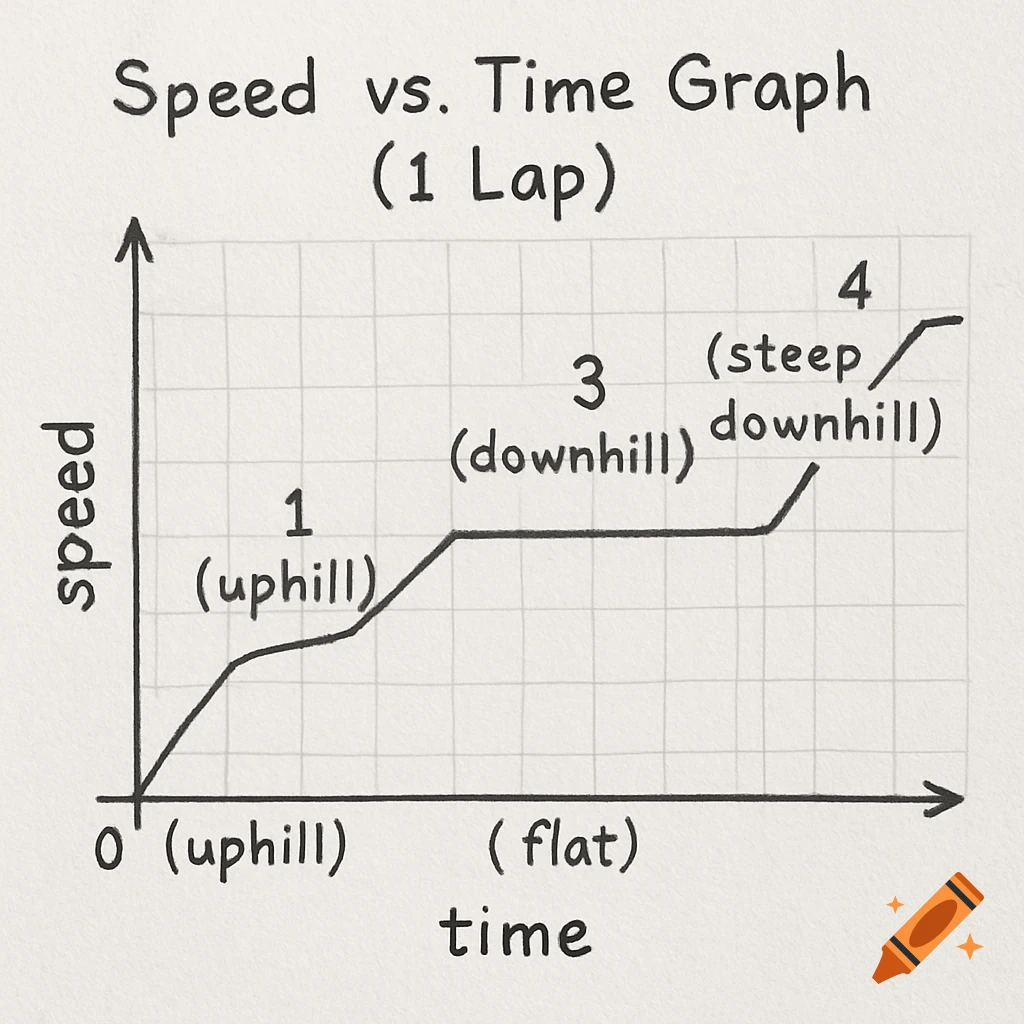
6. a) Speed vs. Time Graph (1 Lap) (To be hand drawn) — Here's how to plan your graph: Section 1 (Uphill): Starts from 0 speed, gradual increase, then flattens — slow increase. Section 2 (Flat): Straight, constant speed line — steady pace. Section 3 (Downhill): Sloped upward line — speed increases. Section 4 (Steep downhill): Steeper upward curve — speed increases quickly. Ends with slight deceleration as he slows down approaching end. Ensure labels: time on x-axis, speed on y-axis, and clear segment markings. See more