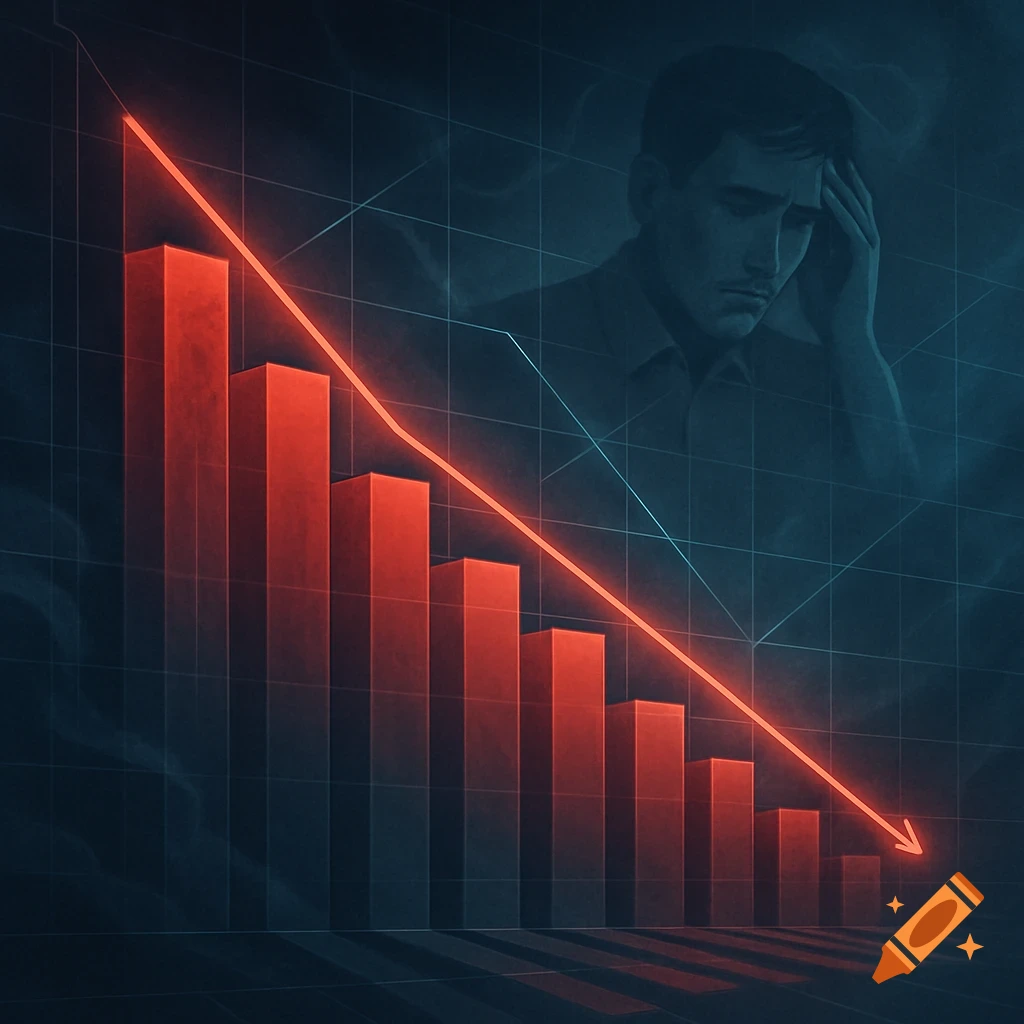
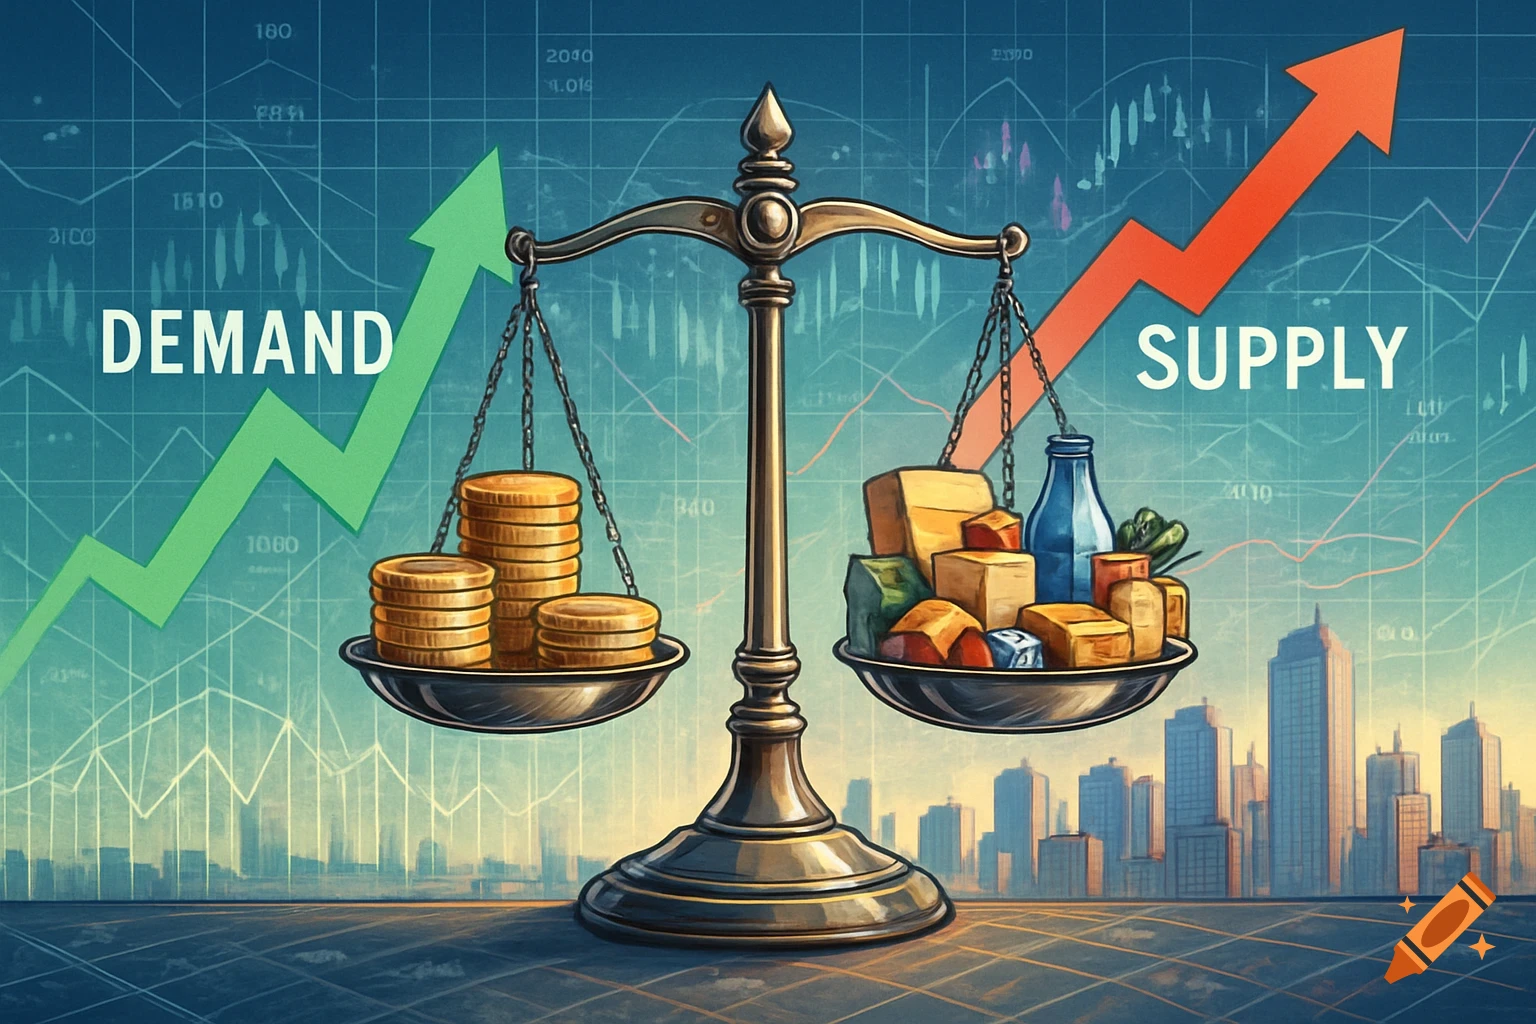
Economic diagram showing the effect of a rate hike on aggregate demand and supply, with shifts in curves and new equilibrium points.
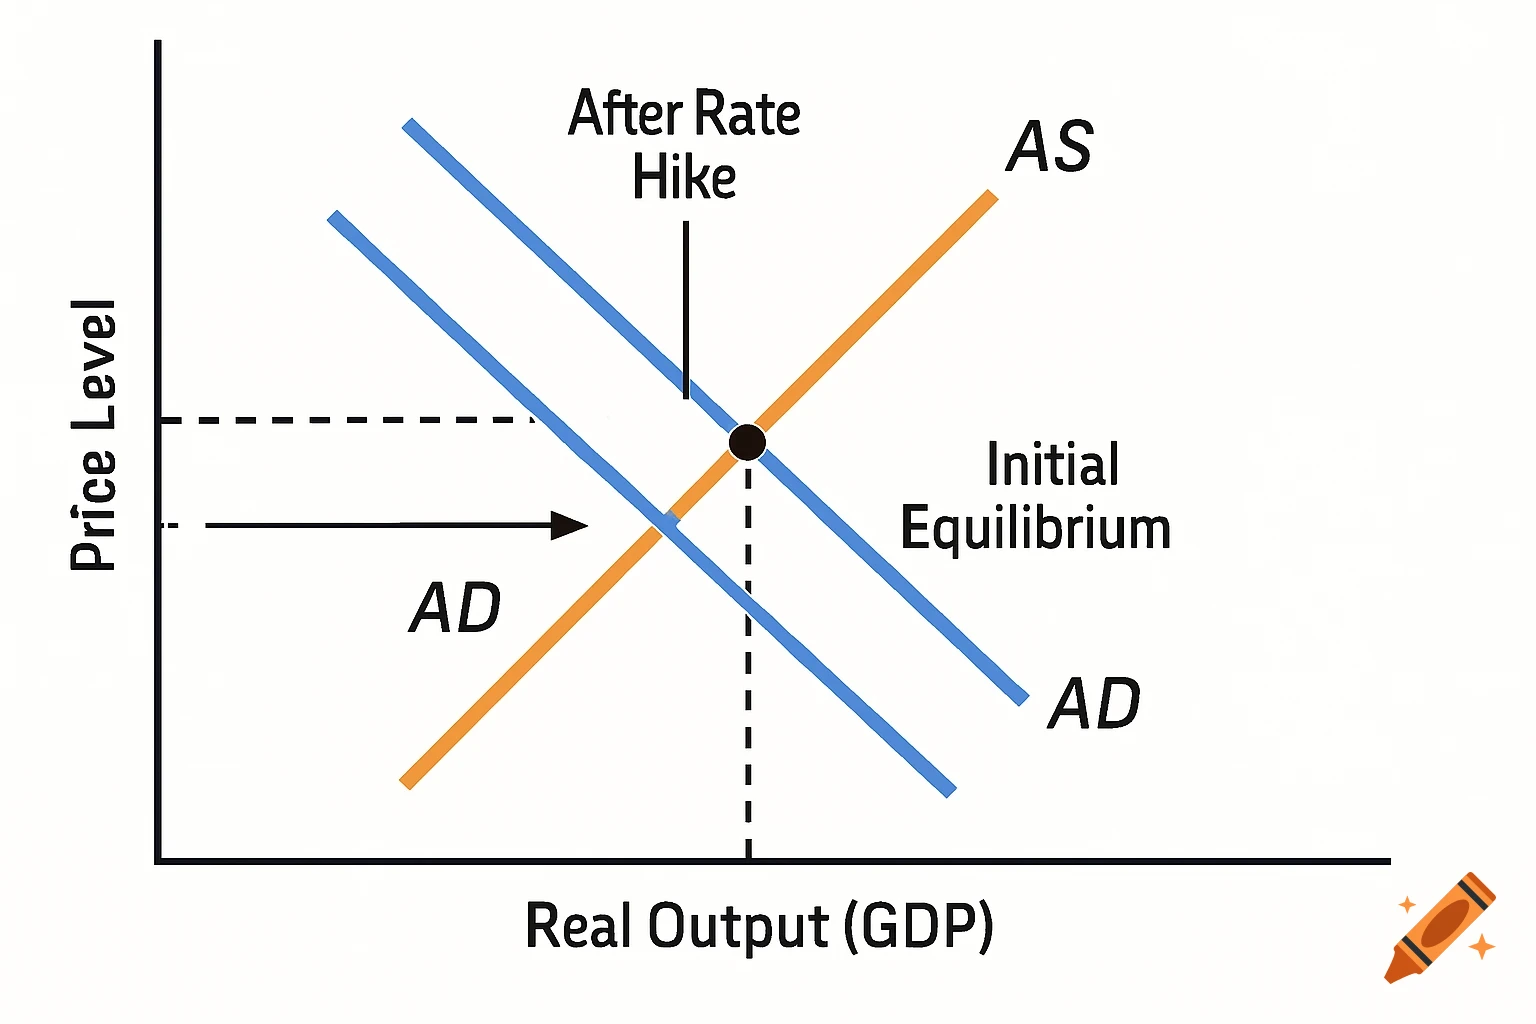
The hypothetical diagram would showcase: - X-axis: Real Output (GDP). - Y-axis: Price Level. - Initial Equilibrium: Intersection of the downward-sloping AD curve and the upward-sloping short-run AS curve. - After Rate Hike: The AD curve shifts left, reducing the price level and controlling inflation. See more