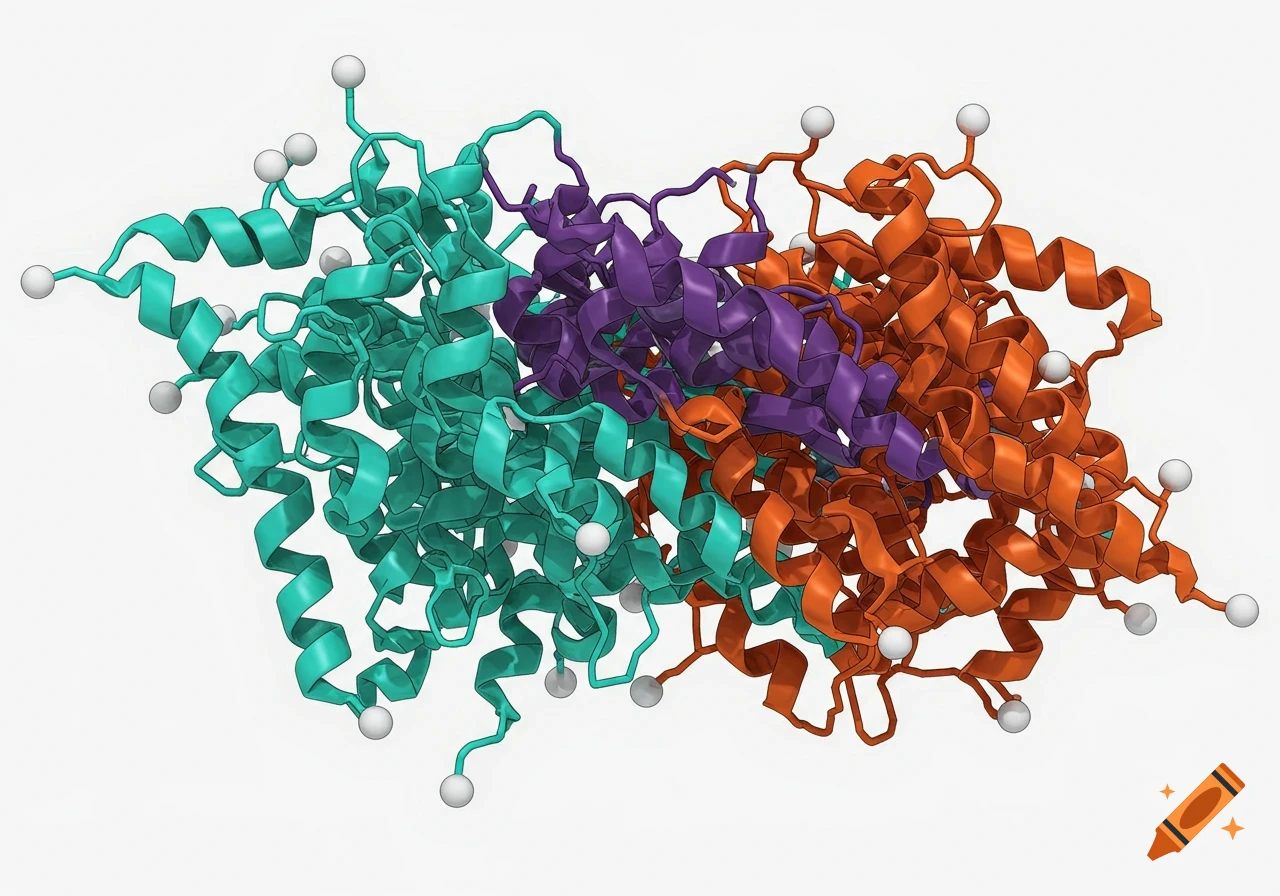
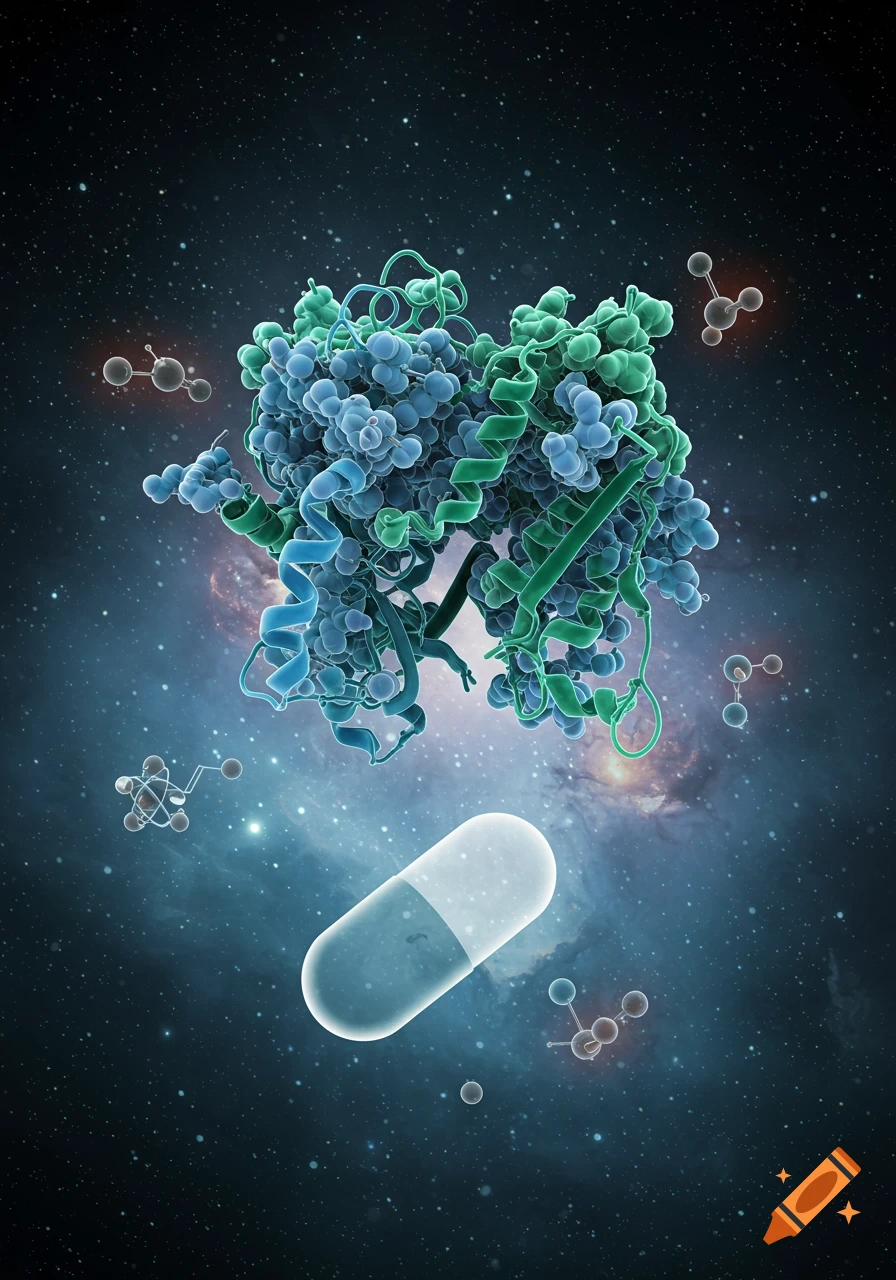
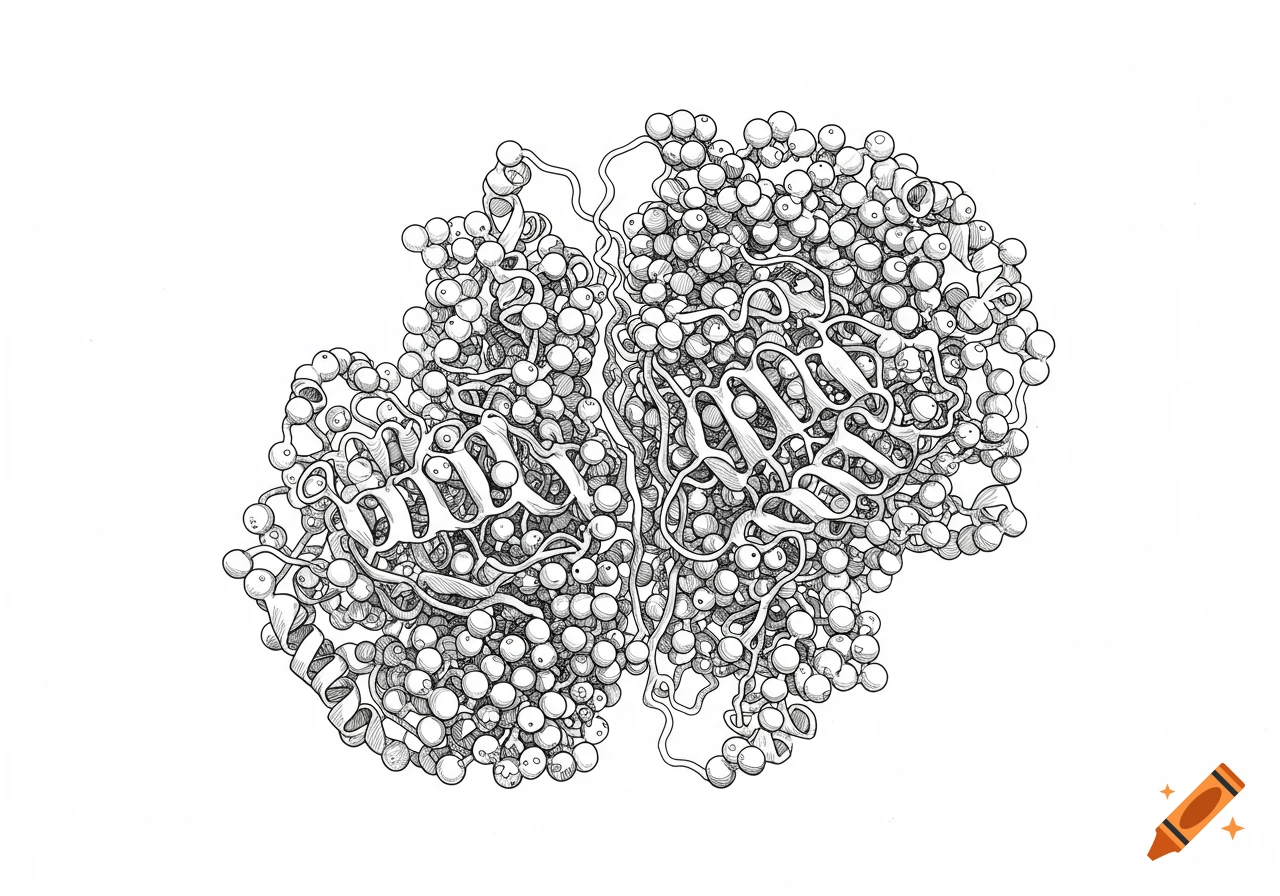
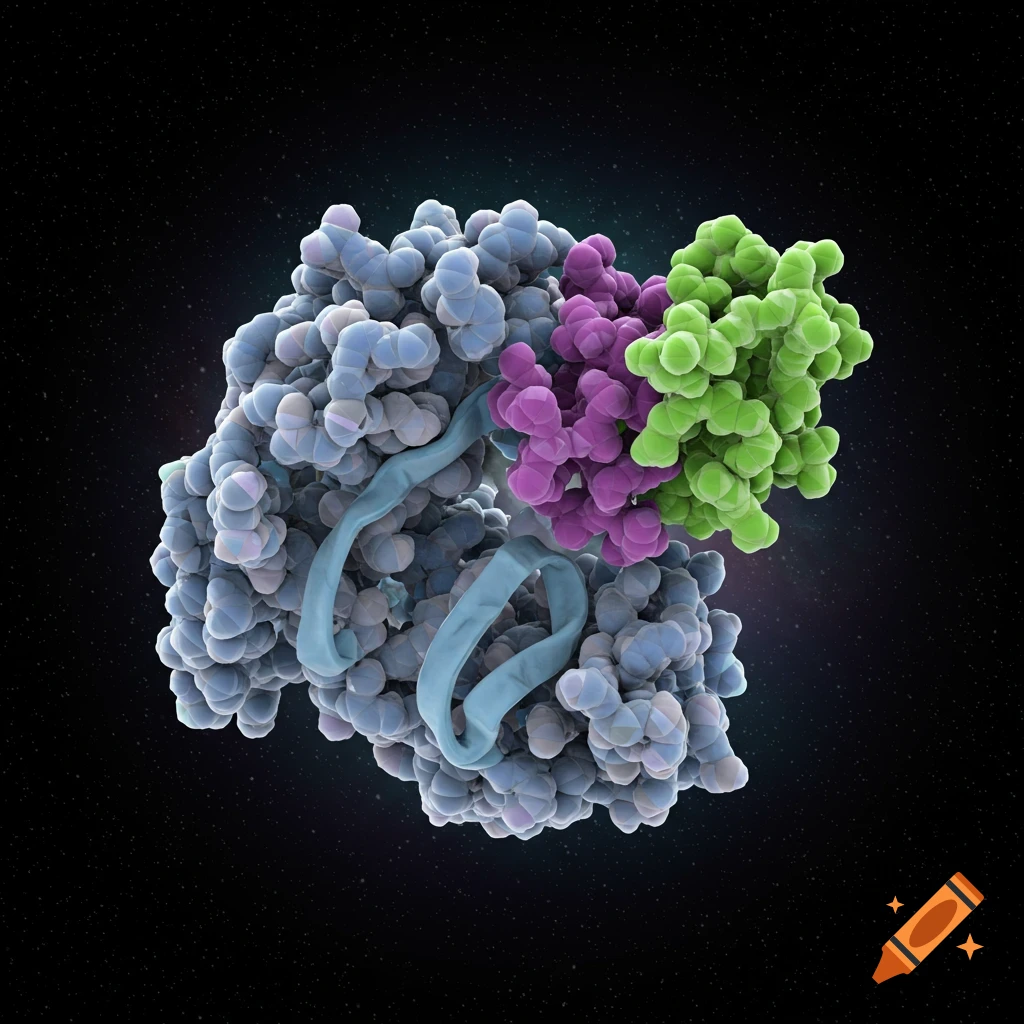
A 3D scientific diagram showing a BACE1 inhibitor pharmacophore, with a grey protein surface and various colored spheres and a hexagon representing different types of molecular interactions and distances.
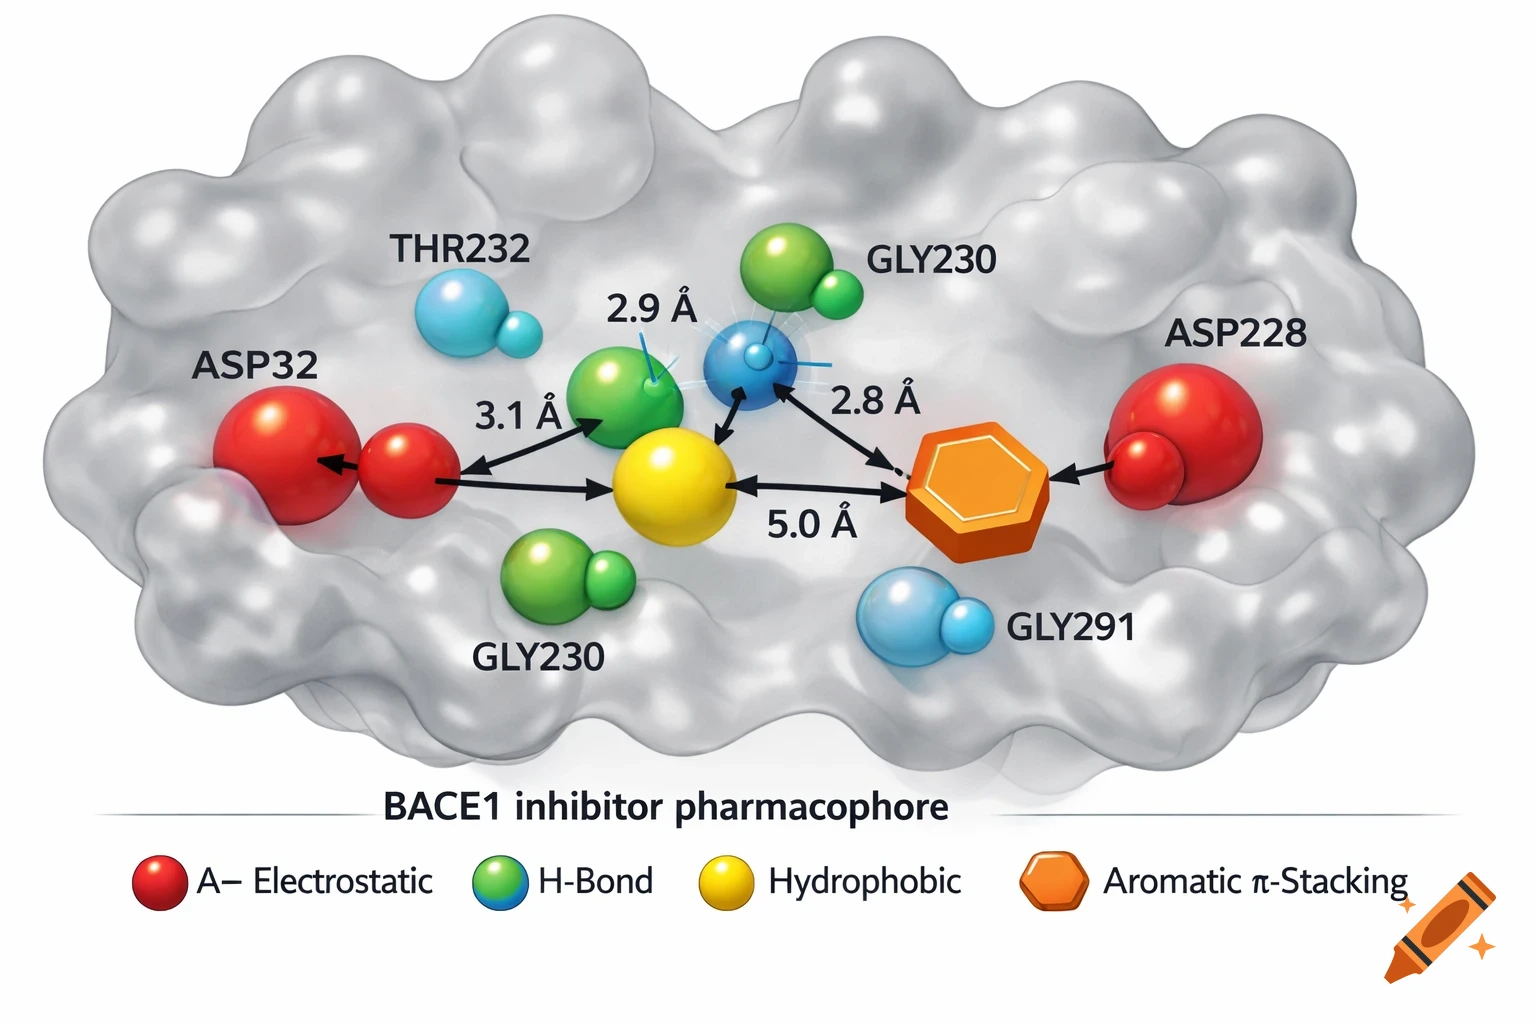
Schéma scientifique professionnel d'un pharmacophore 3D pour inhibiteur de BACE1 (protéase Alzheimer). Vue 3D isométrique haute résolution, style revue Nature : FOND : Surface de poche protéique grise semi-transparente (volume ~400 ų), avec résidus saillants - ASP32 et ASP228 : sphères rouges vives (charges négatives, diam. 1.5 Å) - THR232, THR293, GLY230, GLY291 : sphères bleu/vert (groupes polaires) PHARMACOPHORE CENTRAL (sphères flottantes reliées par flèches noires avec distances en Å) : 1. 2 sphères ROUGES (A-, anionique, diam. 1.2 Å) → 10-12 Å d'écart, près ASP32/ASP228 2. 3 sphères VERTES/BLEUES (HBD/HBA H-bond, diam. 1.0 Å) → 2.5-3.5 Å des Thr/Gly 3. 1 sphère JAUNE (hydrophobe H, diam. 1.5 Å) → 4-6 Å du centre 4. 1 hexagone ORANGE (cycle aromatique R) → parallèle aux zones hydrophobes FLÈCHES : Distances précises (ex. "3.1 Å", "2.8 Å") avec tolérance ±1 Å. LÉGENDE BAS : - Rouge A- : Interaction électrostatique (ASP32/228) - Vert/Bleu : H-bond (THR232/GLY230/291) - Jaune : Hydrophobe - Orange : Aromatique π-stacking Éclairage naturel, labels clairs, fond blanc, haute résolution (4K), publication-ready. See more