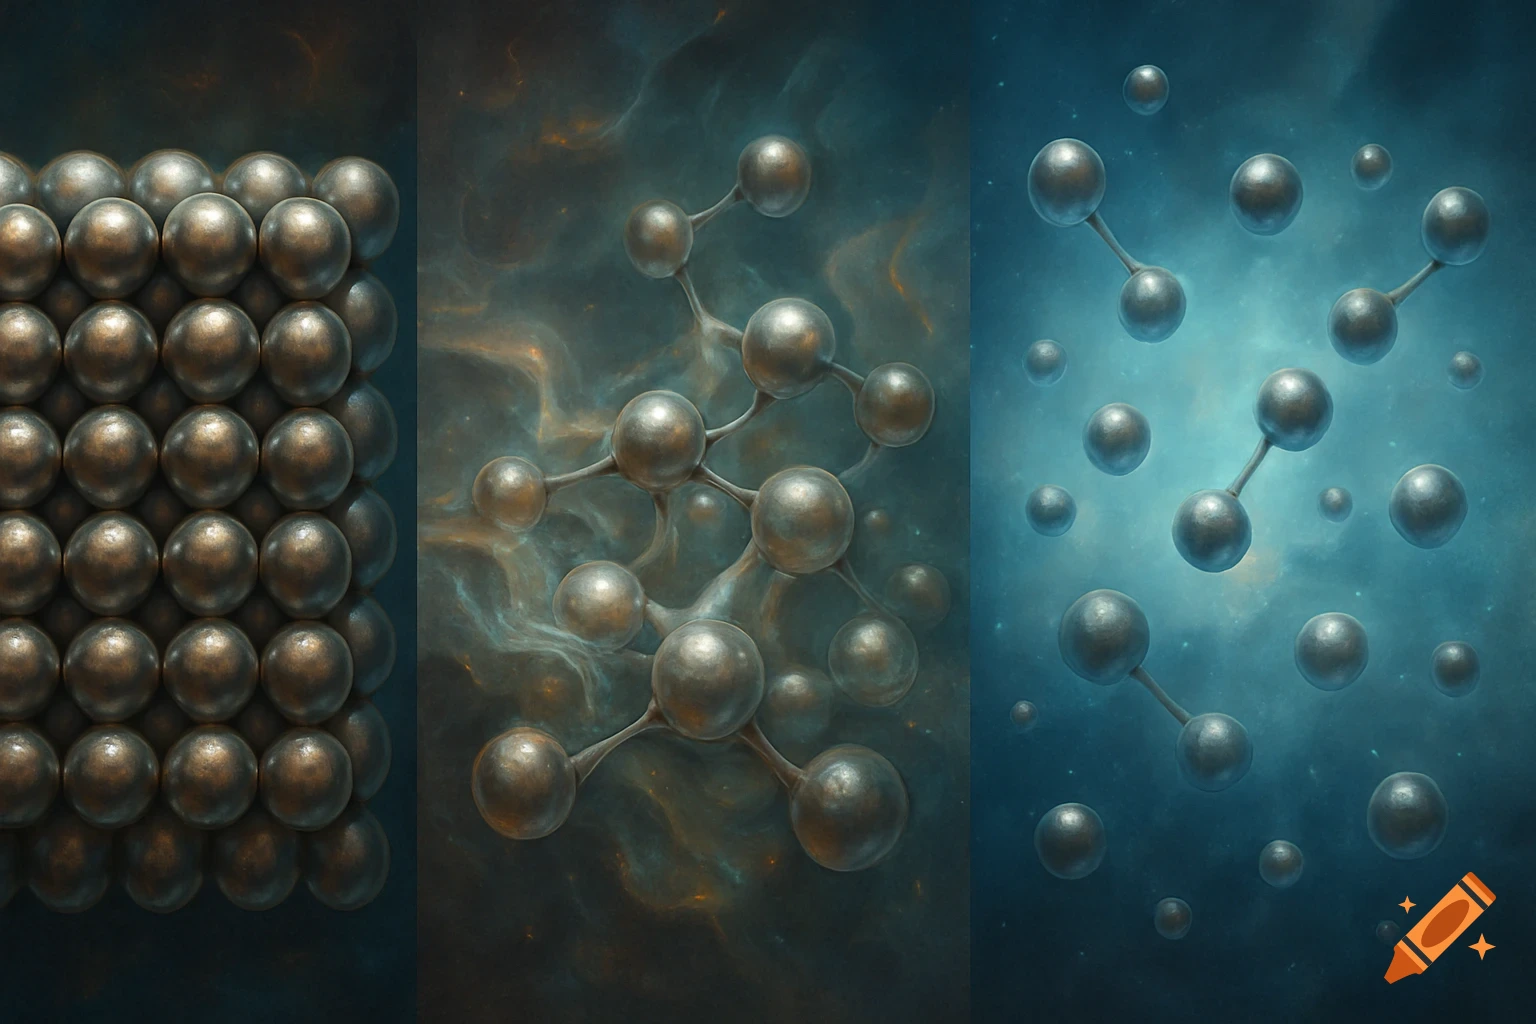
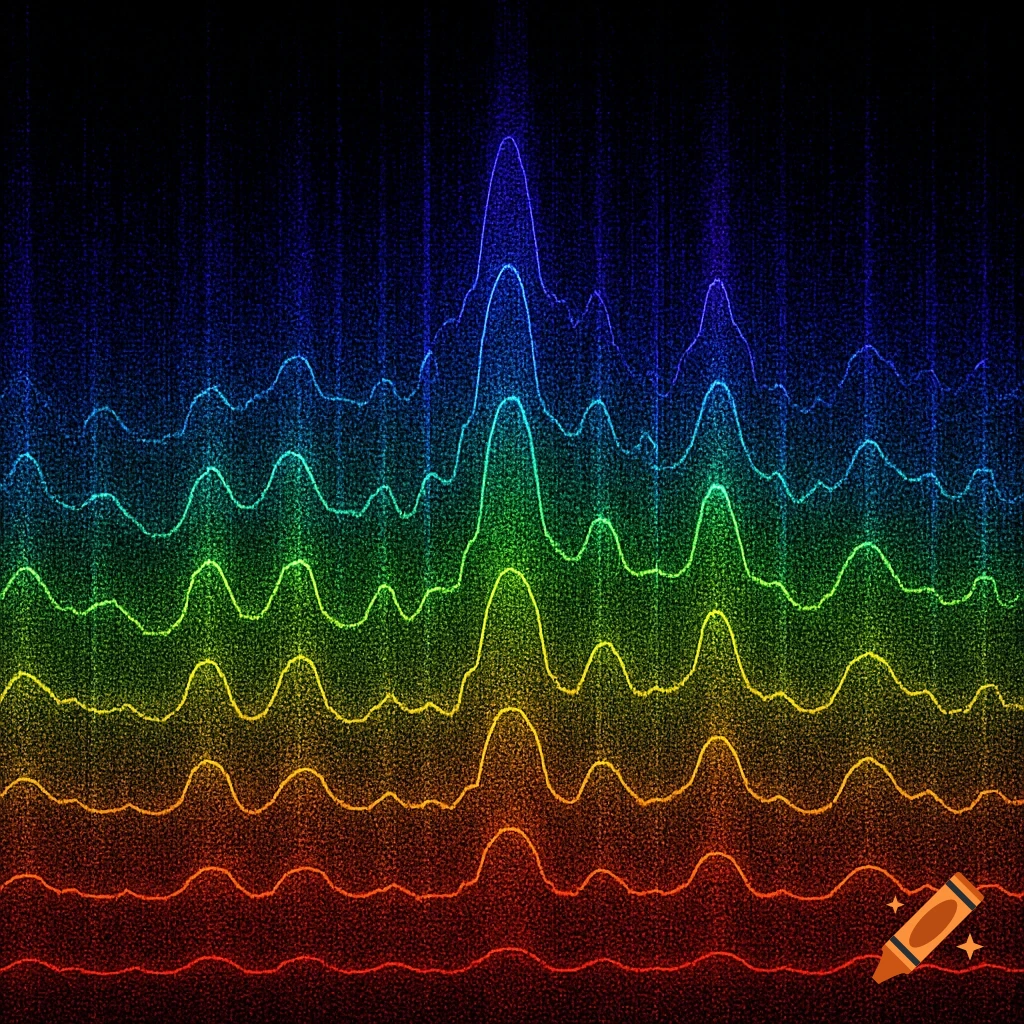
Scientific diagram showing the real-time formation of gold nanostars with TEM images at different time points and corresponding UV-Vis spectra.
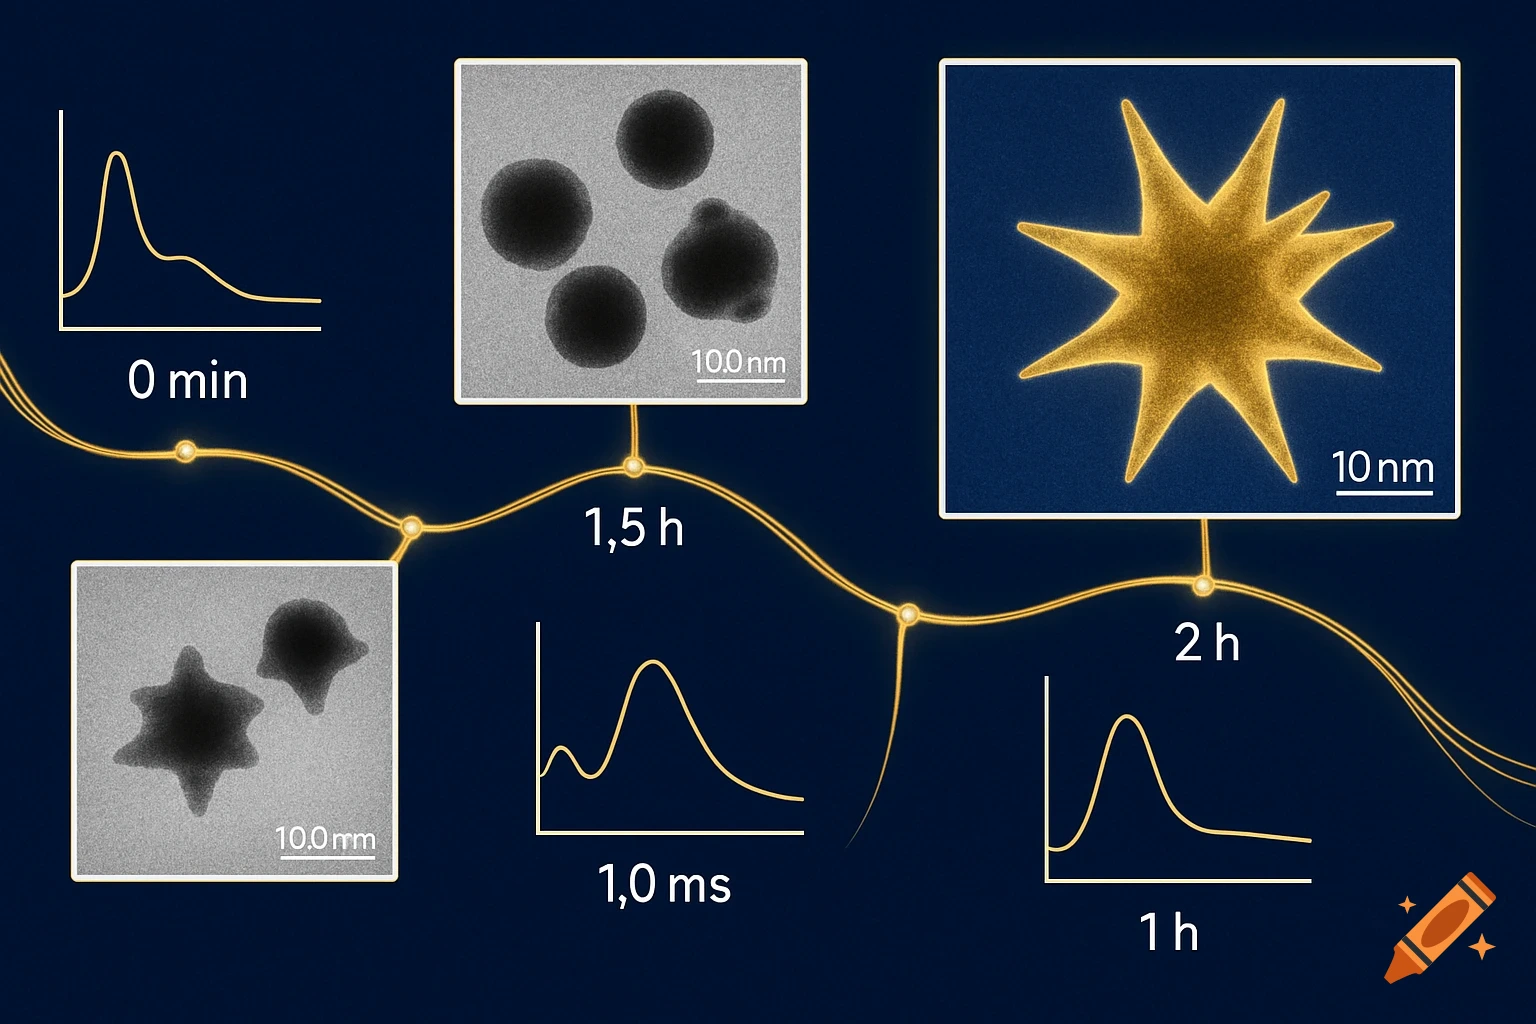
Can you help me come up with idea on how to creat a figure (for a scientific paper) showcasing the real-time monitoring of the formation of gold nanostars where every 30 minutes: UV-visible spectra and DLS/zeta were recorded; and every 1h30 (at 0h; 1h30, 3h00, 4h30 and 6h00) the sample was deposited for TEM visualization See more