A four-quadrant chart plotting ASP vs Value, with quadrants labeled Won't retain, Where to focus, Death Zone, and Low-CAC Inbound.
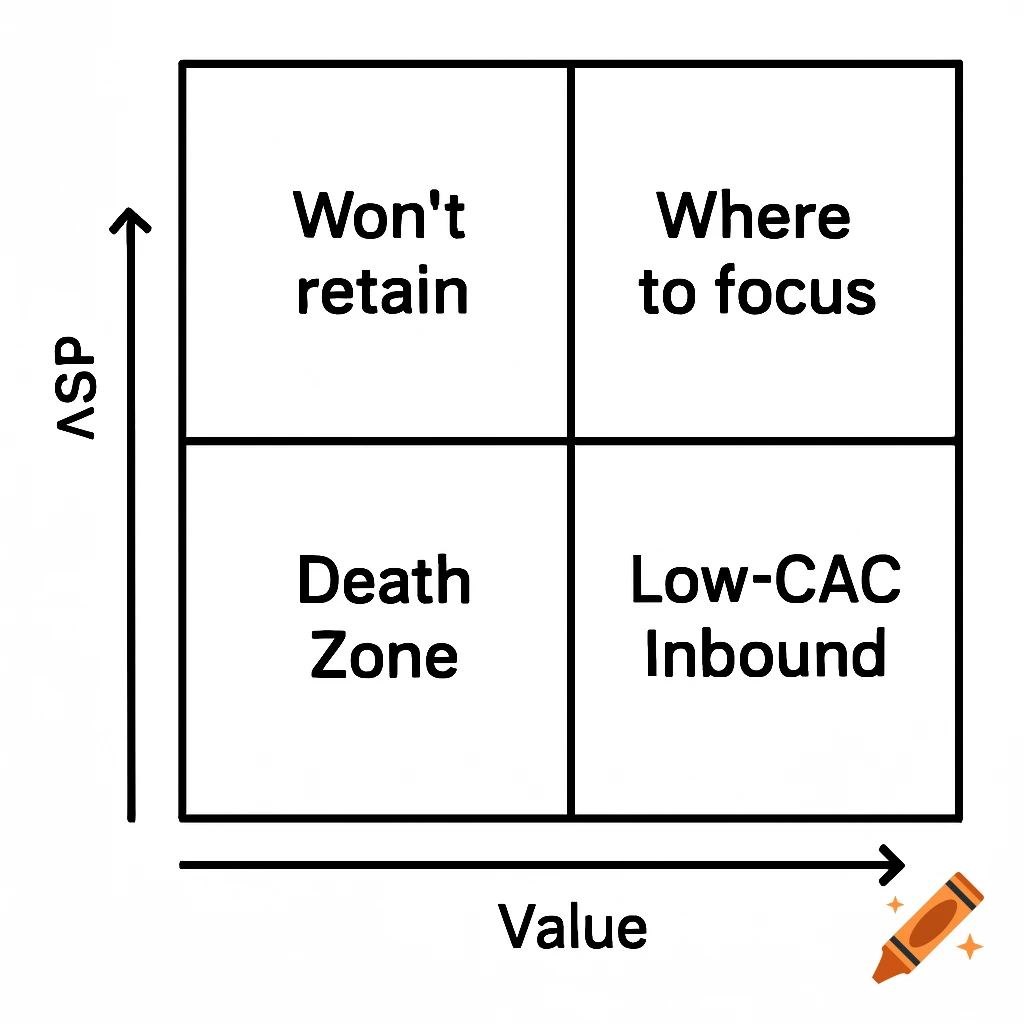
A quadrant chart with two labeled axes: the horizontal axis represents 'Value' increasing from left to right, and the vertical axis represents 'ASP (Average Selling Price)' increasing from bottom to top. The chart is divided into four distinct quadrants, each labeled to indicate different strategic areas: - Top left quadrant: 'Won't retain' – high ASP but low value. - Top right quadrant: 'Where to focus' – high ASP and high value. - Bottom left quadrant: 'Death Zone' – low ASP and low value. - Bottom right quadrant: 'Low-CAC Inbound' – low ASP but high value. The chart provides a visual framework to evaluate business strategies based on price and value considerations See more