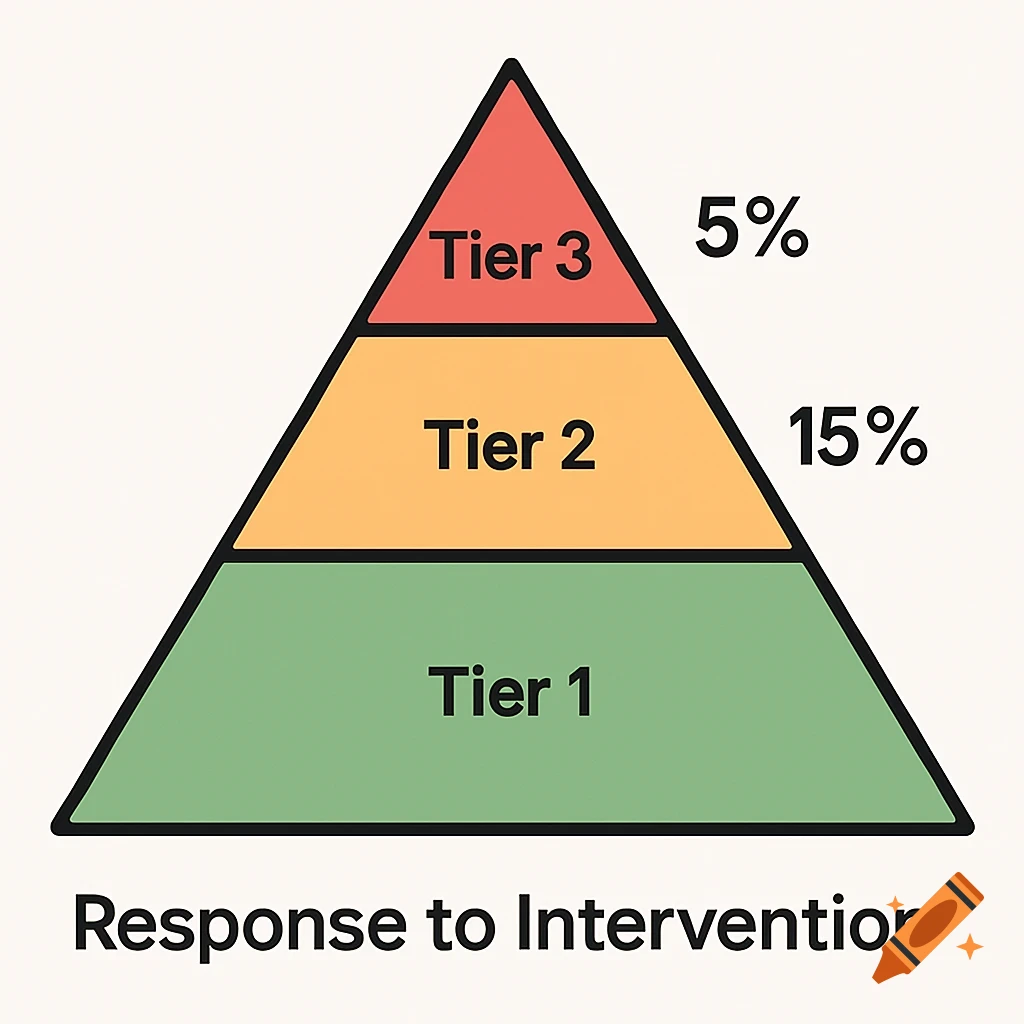
A triangular graph showing a Response to Intervention model. The bottom green section is Tier 1, the middle orange section is Tier 2 with 15%, and the top red section is Tier 3 with 5%.
could you please create a triangular graph that shows a response to intervention model, labelled and colour coded - green Tier One at the bottom taking 80% of the shape, amber in the middle -labelled Tier Two 15% and light red colour at the top - labelled Tier Three 5%? See more