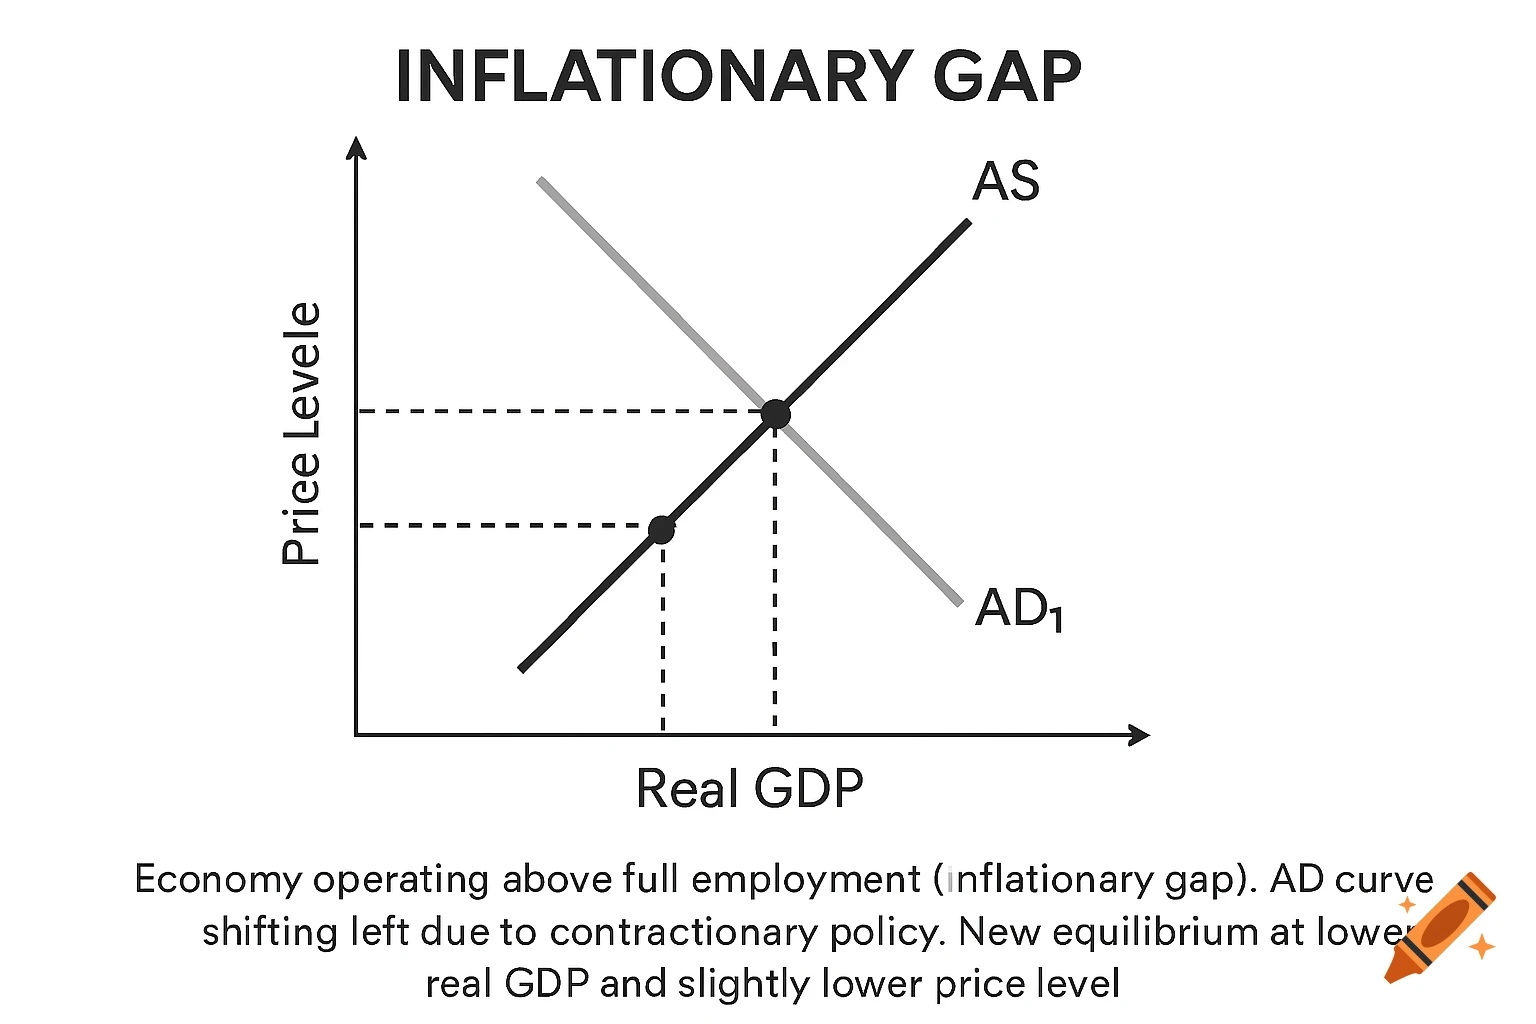
An economic graph showing Aggregate Supply (AS) and Aggregate Demand (AD1) curves intersecting, with dashed lines indicating price and GDP levels. The title reads "INFLATIONARY GAP". Text below describes an economy operating above full employment.
Draw an economy operating above full employment (inflationary gap) Show AD curve shifting left due to contractionary policy New equilibrium at lower real GDP and slightly lower price level See more