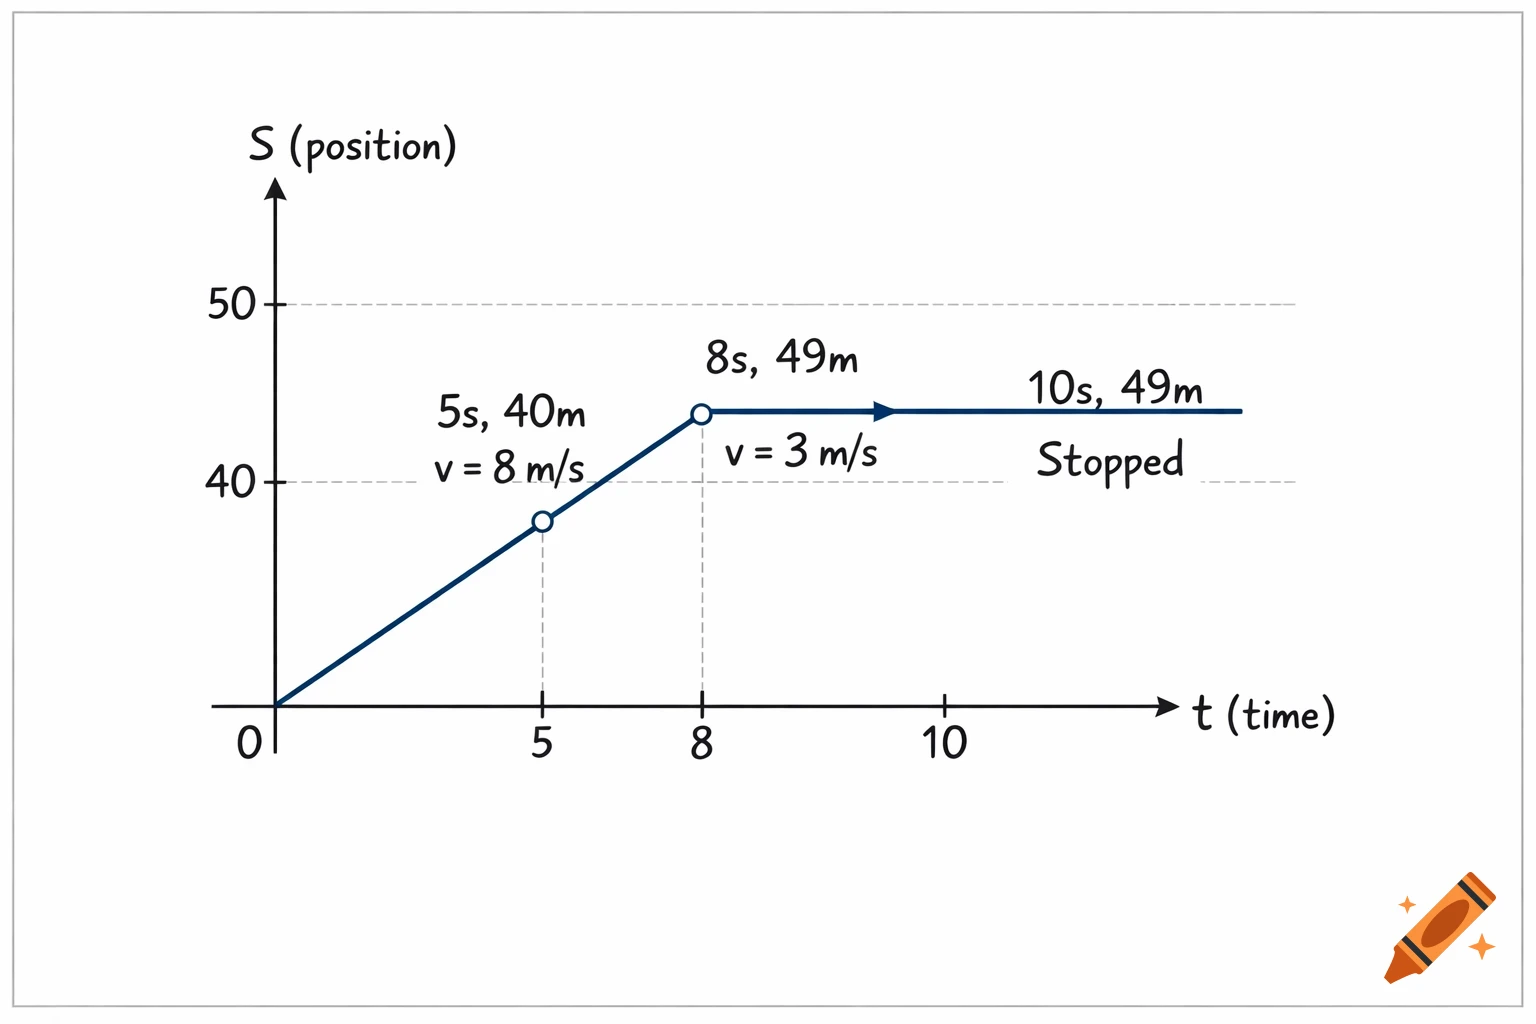
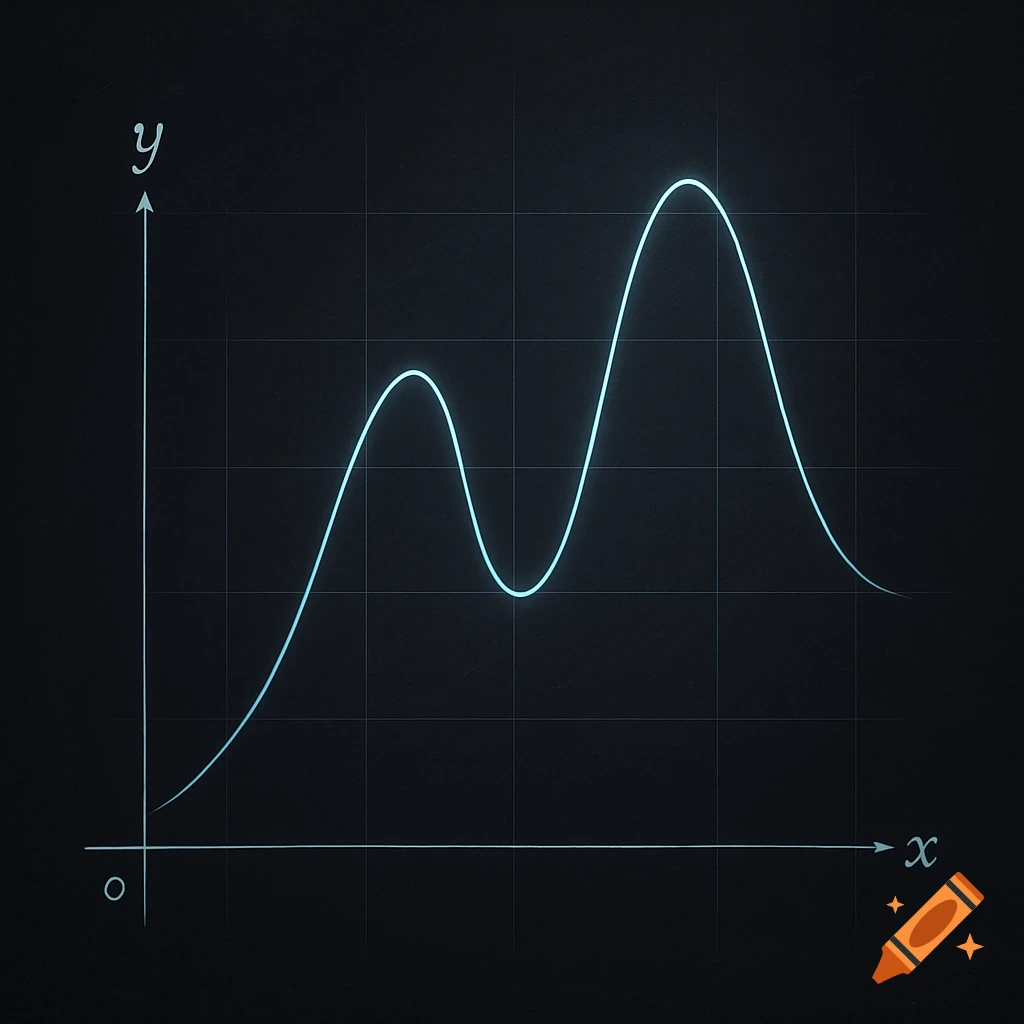
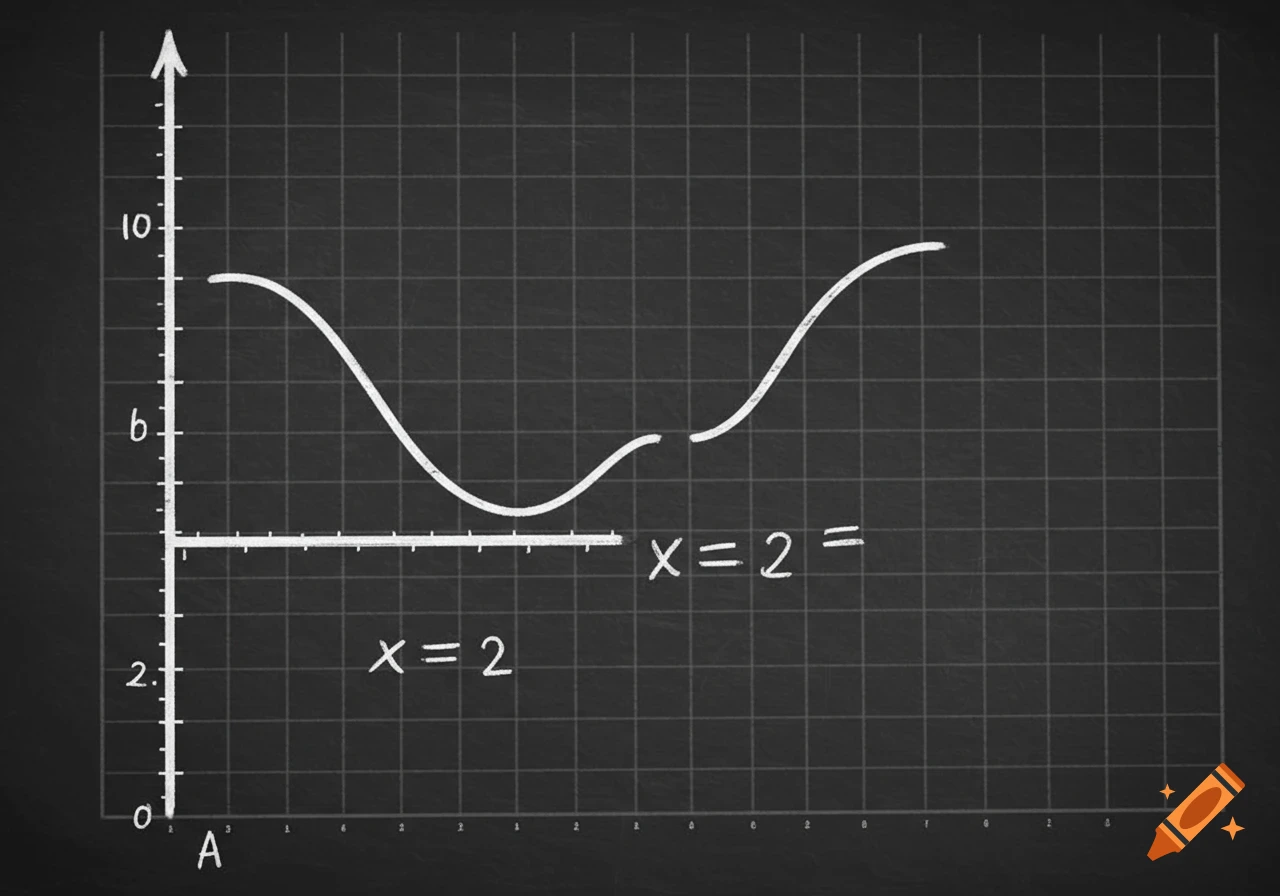
A position-time graph showing a blue line segment from 0 to 5 seconds with a velocity of 8 m/s to 40m, then from 5 to 8 seconds with 3 m/s to 49m, and then a flat line from 8 to 10 seconds indicating stopped at 49m.
Ein Wagen fährt für 5s mit 8 m/s, in den folgenden 3s fährt er nur noch mit 3 m/s, bevor er für 2 s stehen bleibt. a) zeichne das zugehörige t-s-Diagramm und b) das zugehörige t-s-Diagramm dieser Bewegung See more