Economic diagram showing supply and demand curves and the effect of a subsidy on the EV market
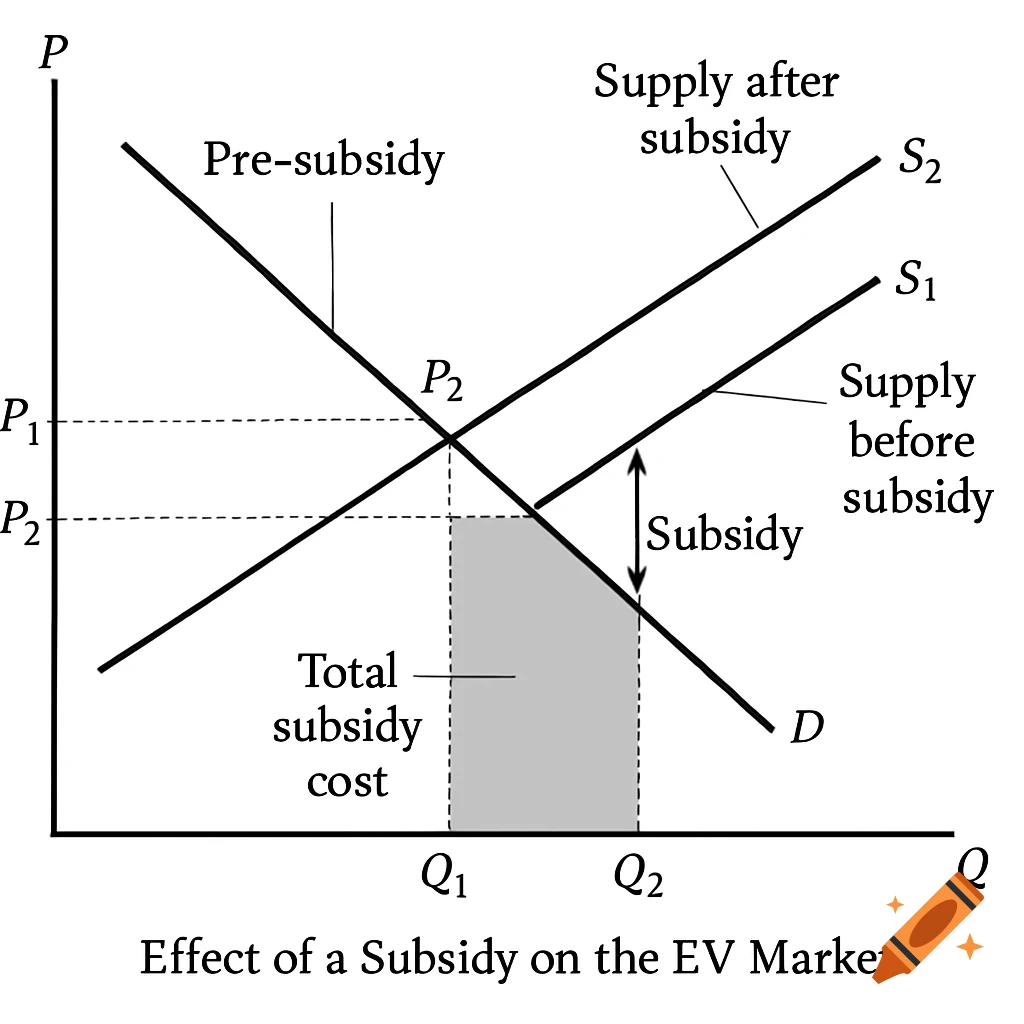
Diagram: Effect of a Subsidy on the EV Market Key Components: Axes: X-axis: Quantity of EVs (Q) Y-axis: Price of EVs (P) Curves: Demand (D): Downward-sloping. Supply before subsidy (S₁): Upward-sloping. Supply after subsidy (S₂): Shifted rightward/downward by the subsidy amount. Equilibrium Points: Pre-subsidy: Intersection of D and S₁ → Price = P₁, Quantity = Q₁. Post-subsidy: Intersection of D and S₂ → Price = P₂, Quantity = Q₂. Subsidy Representation: The vertical distance between S₁ and S₂ = per-unit subsidy. Total subsidy cost = (P₃ – P₂) × Q₂ (shaded area). See more