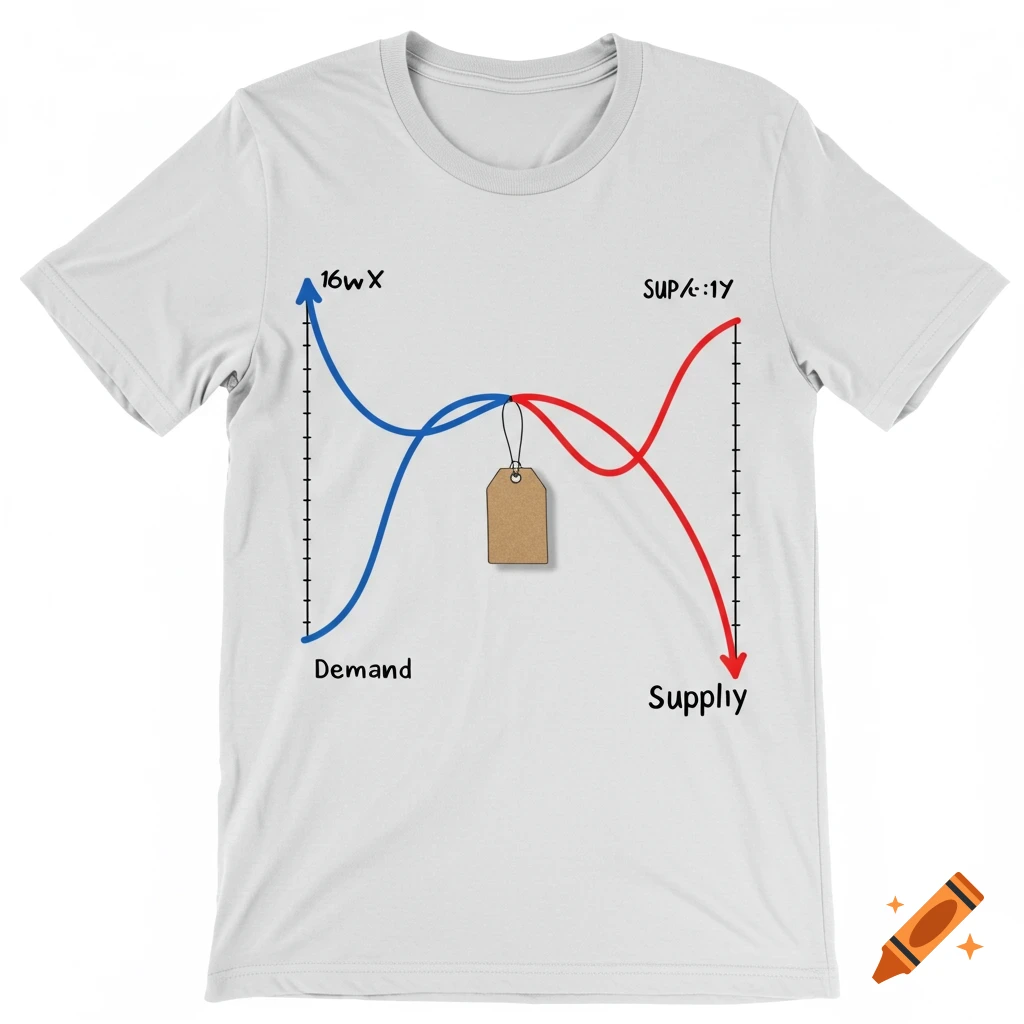
Line graph showing a cost function for t-shirt production, with startup costs and marginal cost indicated.
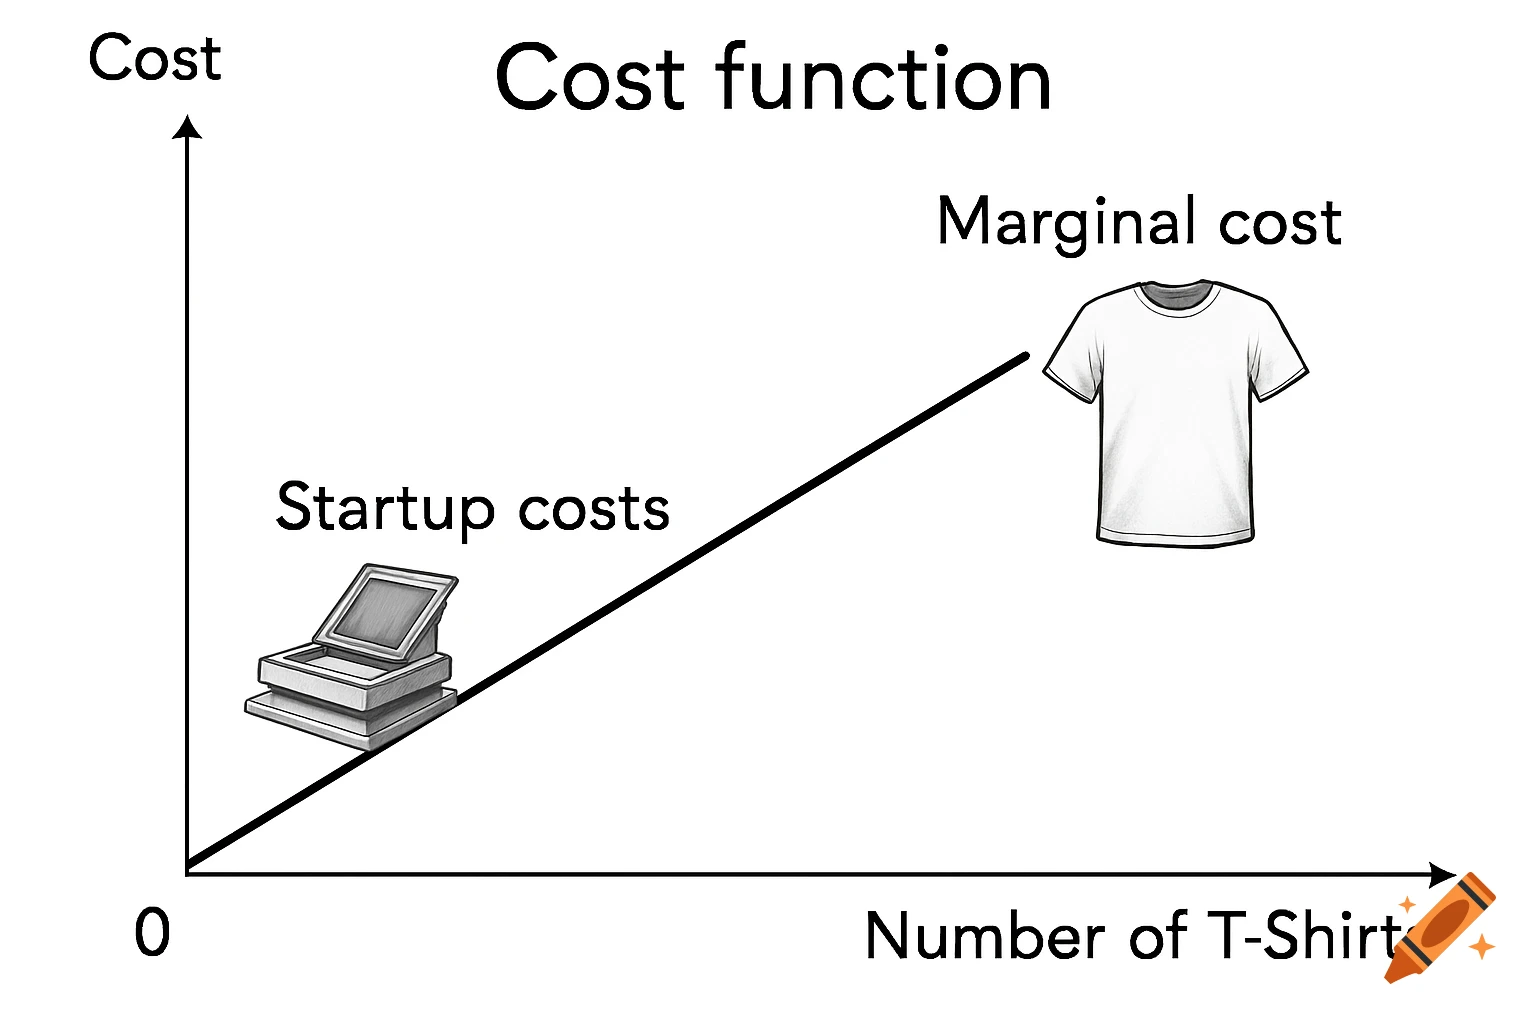
I am looking to produce a line graph illustrating a cost function. It will represent a business screen printing t-shirts. The y-intercept is start up costs and should show a pronter next to the intercept. The line rising to the right should show an image of a t-shirt representing the marginal cost, or cost to produce one more item See more