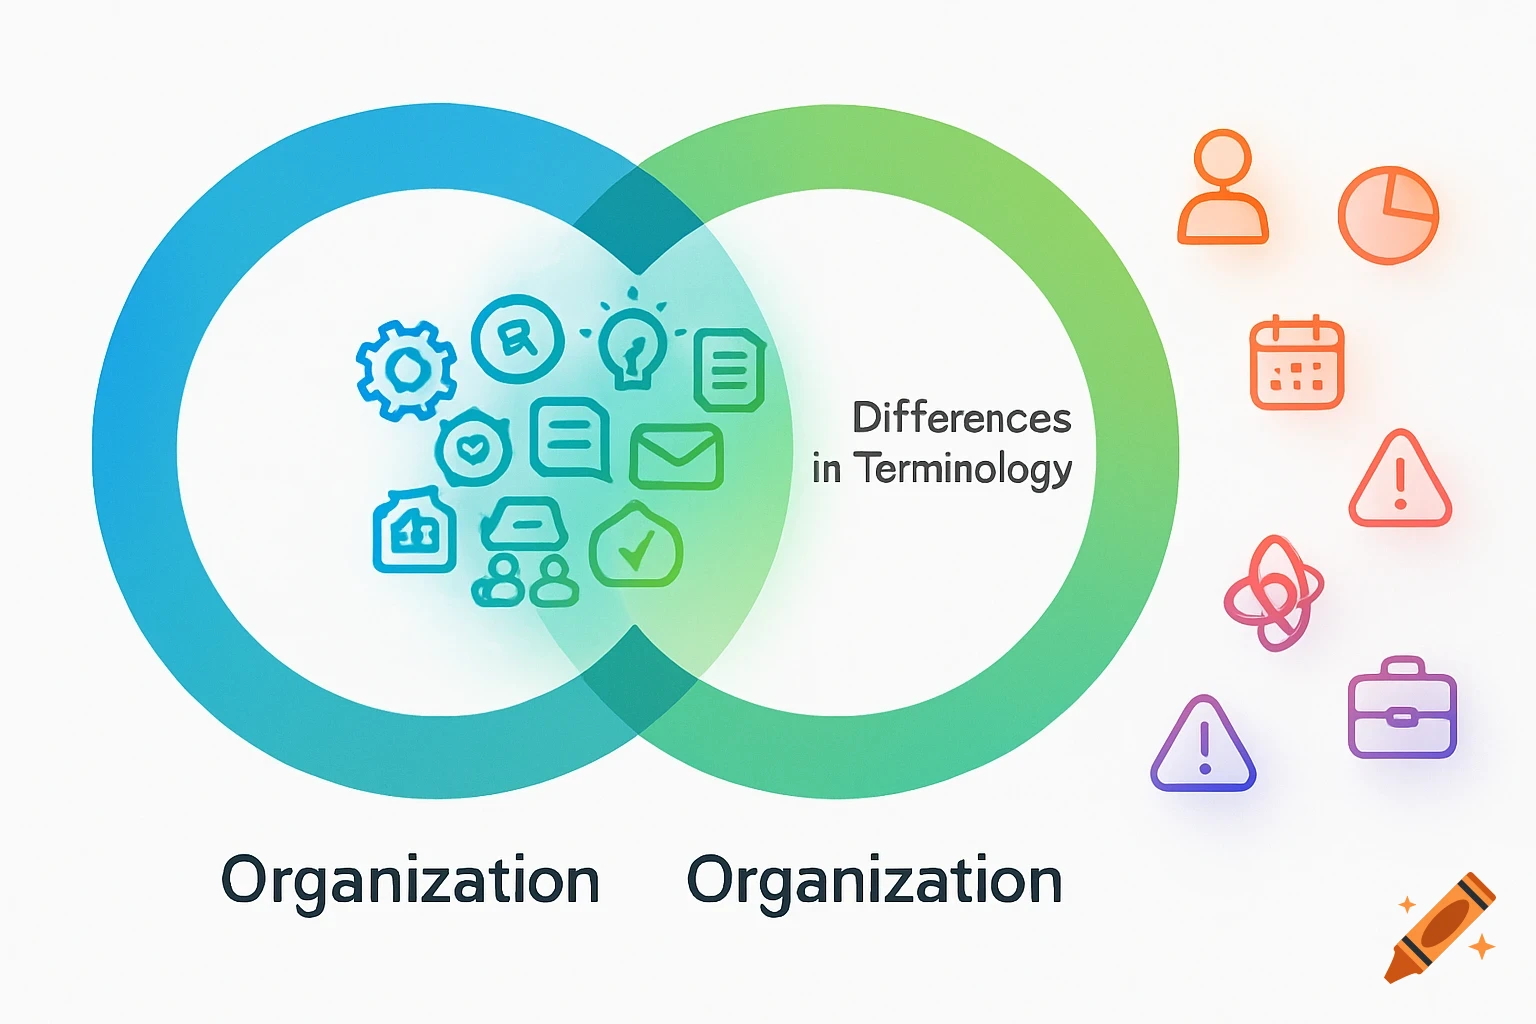
A clean academic concept map illustrating the relationship between Ecotoxicology, Environmental Toxicology, and Remediation processes.
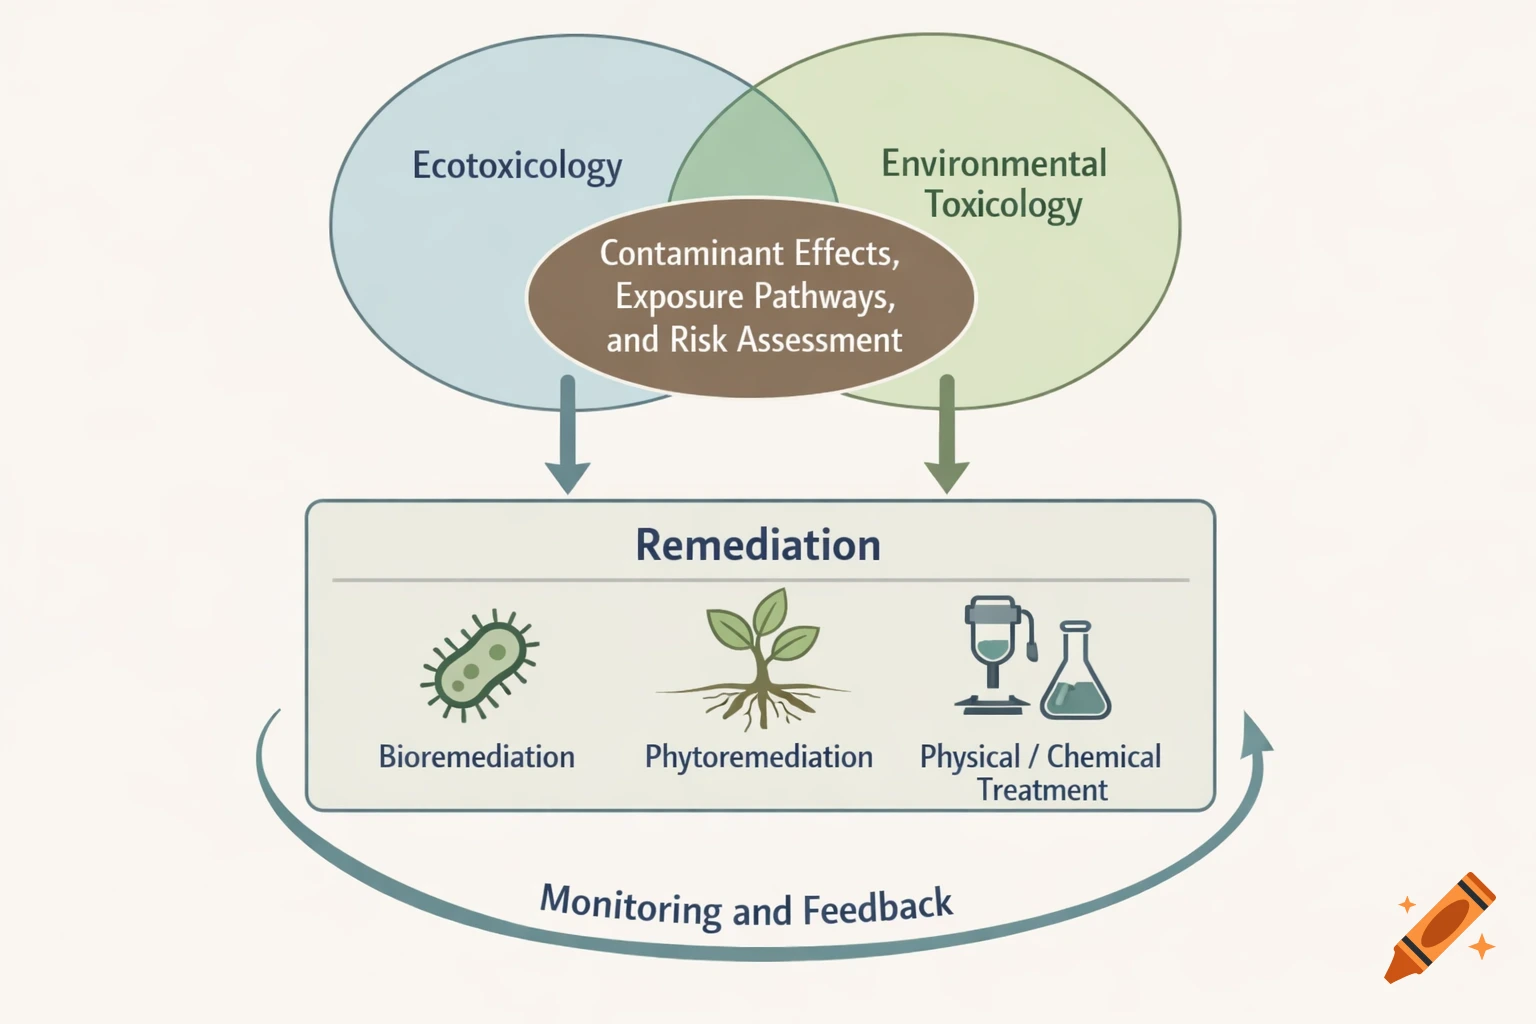
Create a clean, professional academic concept map illustrating the relationship between Ecotoxicology, Environmental Toxicology, and Remediation. The diagram should be on a white or light neutral background, using soft earth-tone colors (greens, blues, and muted browns). Place two overlapping circles at the top center of the image: The left circle labeled “Ecotoxicology” The right circle labeled “Environmental Toxicology” The overlapping area between the circles labeled “Contaminant Effects, Exposure Pathways, and Risk Assessment” Below the two circles, place a large rectangular box labeled “Remediation”. Draw downward arrows from both circles pointing toward the Remediation box, indicating that ecotoxicology and environmental toxicology inform remediation strategies. Inside or around the Remediation box, include smaller labeled elements or icons representing: Bioremediation (microbes or bacteria icon) Phytoremediation (plant or roots icon) Physical/Chemical Treatment (filter or lab flask icon) Add a curved arrow looping back upward from the Remediation box to the overlapping area of the two circles, labeled “Monitoring and Feedback”, showing that remediation outcomes inform future toxicological assessment. Use simple scientific icons, thin lines, and clear readable text. The overall style should resemble a textbook-quality environmental science diagram, minimalistic, organized, and easy to interpret. See more