Create
Remove BG
Search
Categories
Tutorial
My images
Upgrade to Pro
Help
Pro
Sign up
Retouch
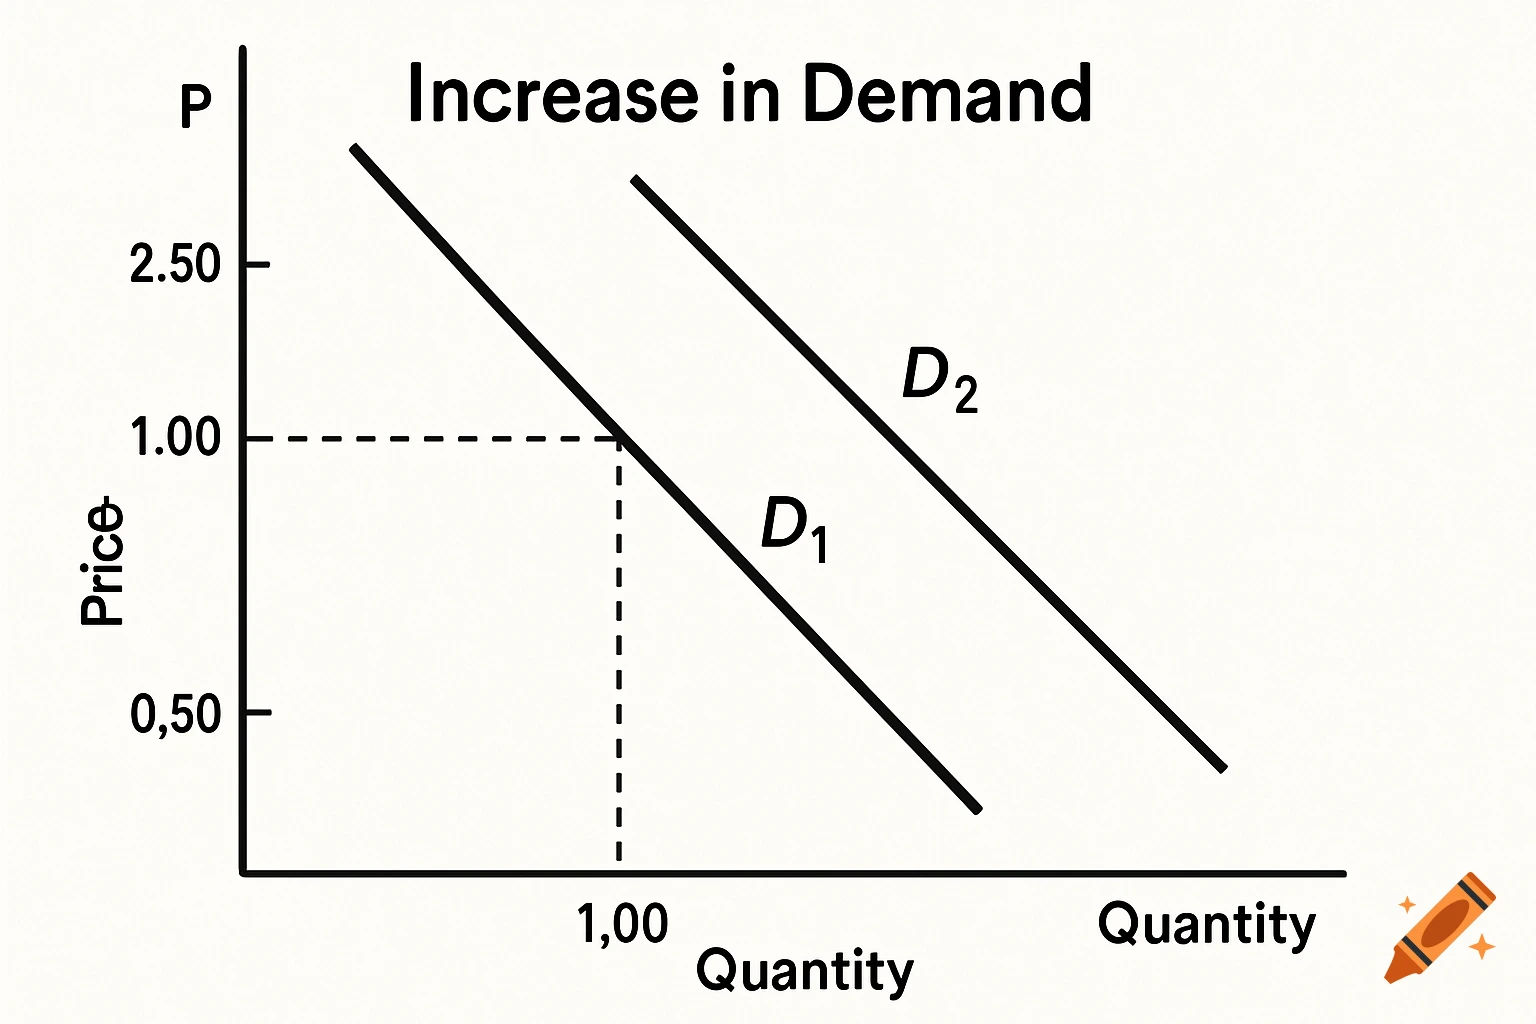
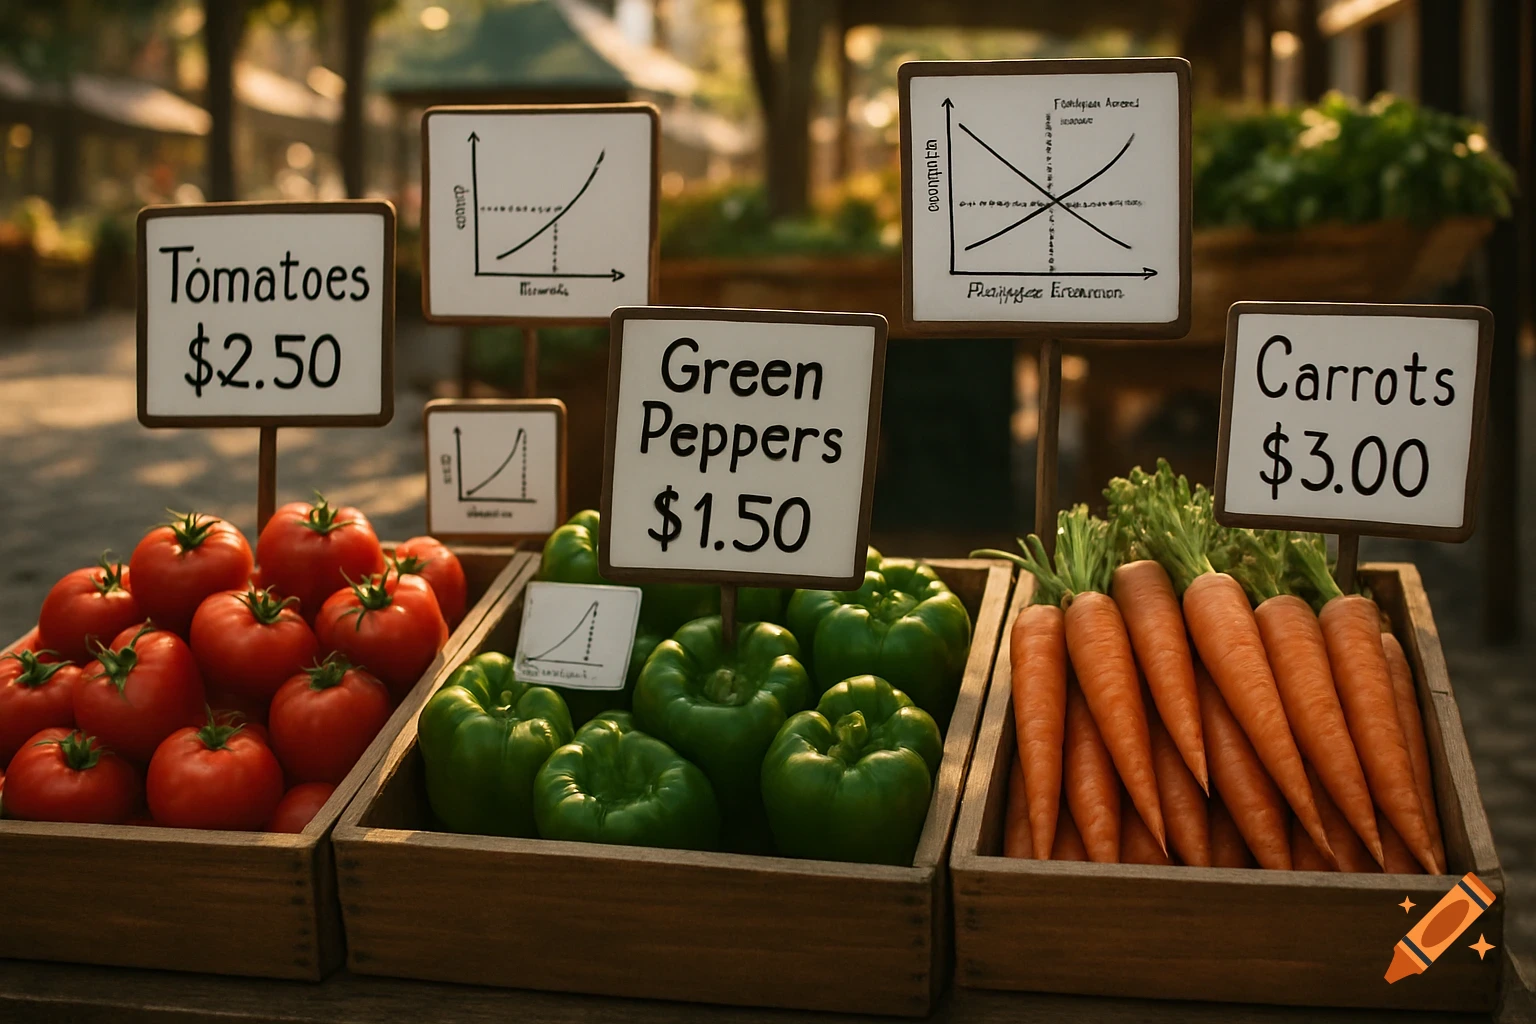
Plot the original demand curve (D1) at various price points to represent the initial demand. Then, plot the new curve (D2) to show the increase in demand at the same price point of $1.00. See more
Infos
Get it on a shirt