A bar graph showing task performance predicted by IQ, Openness, and Emotional Intelligence.
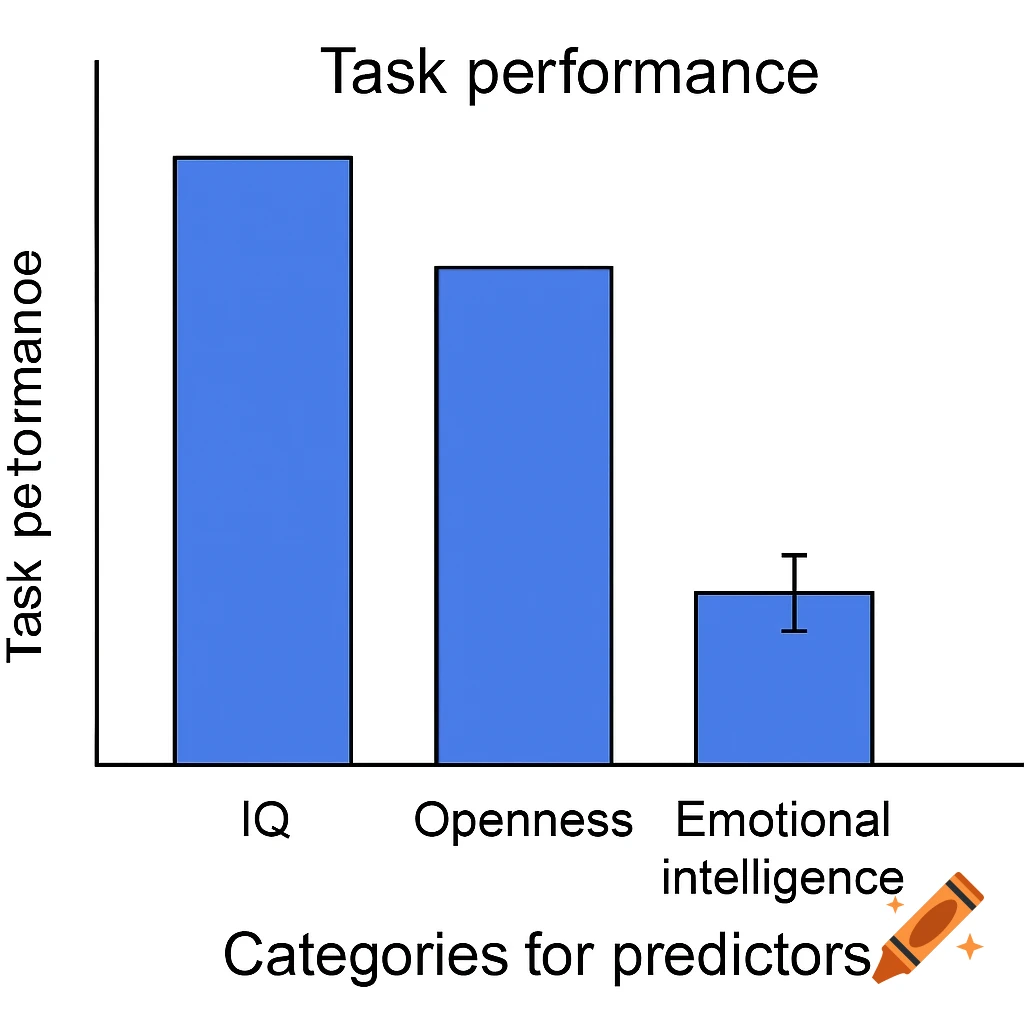
bar graph with the following key information: X-axis: Categories for predictors (IQ, Openness, Emotional Intelligence) Y-axis: Task performance (this could be either accuracy or reaction time, depending on which metric you prefer to showcase) For IQ and Openness, you can show a noticeable difference in task performance (faster/accurate responses). For Emotional Intelligence (EI), show minimal difference, reflecting the finding that EI did not significantly predict task performance. See more