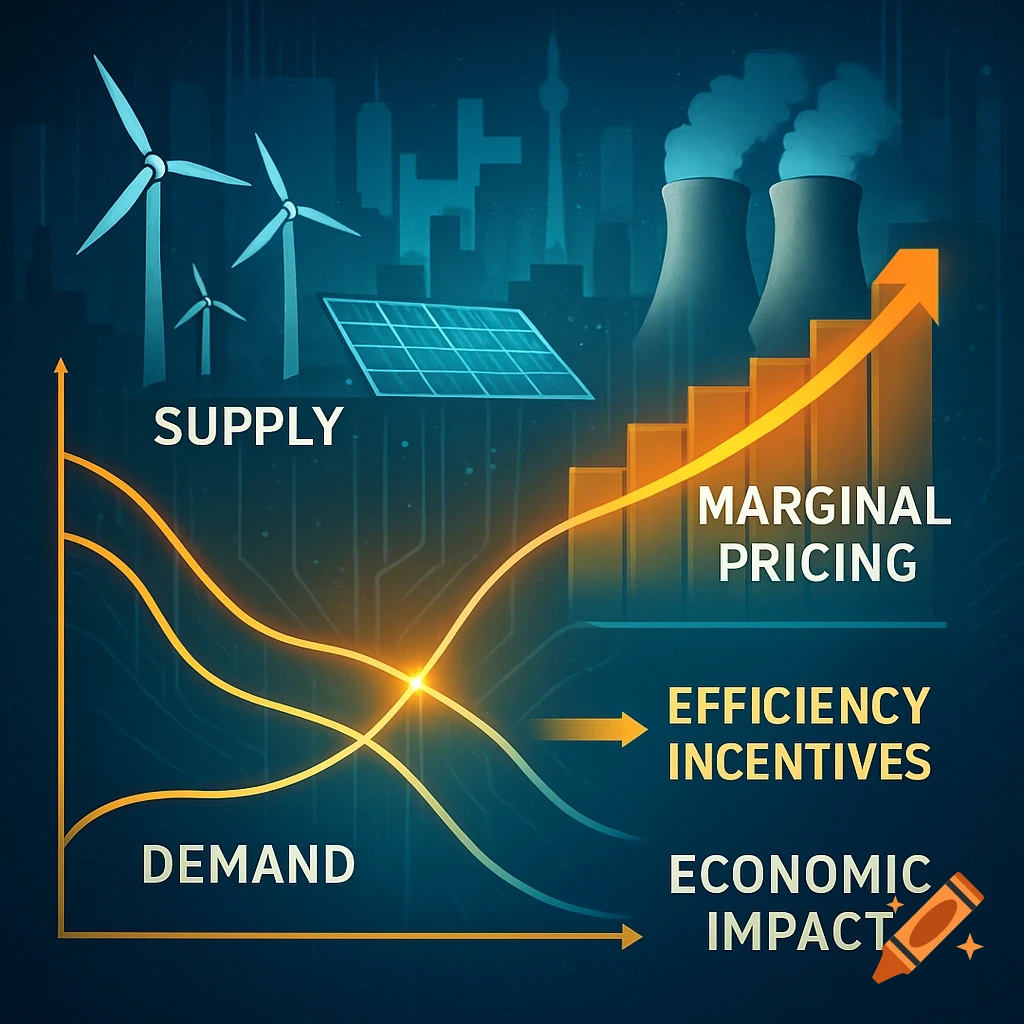
A supply and demand graph showing a leftward shift in the supply curve.
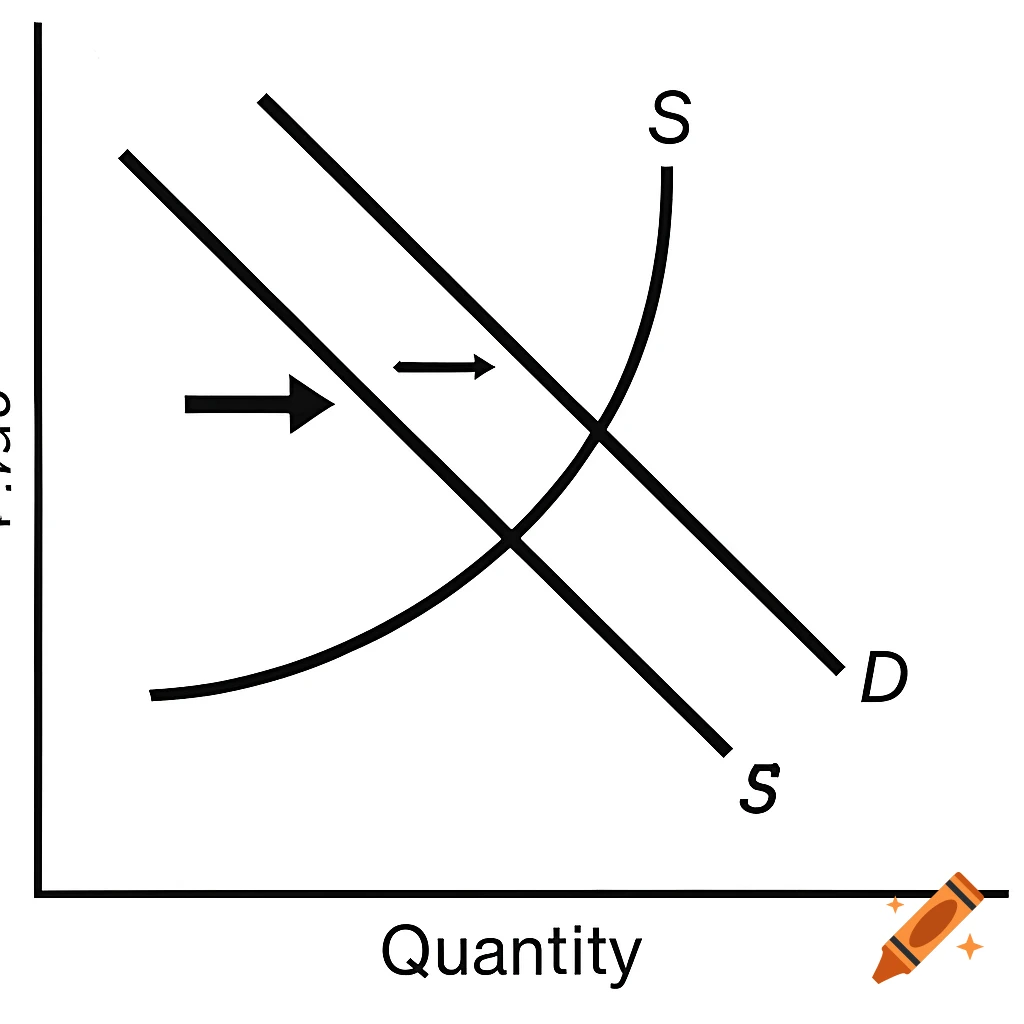
✅ Example #1: Decline in Popularity of Fidget Spinners What’s happening? Tastes and preferences have shifted away from fidget spinners. This causes the demand curve to shift left (a decrease in demand). Graph features: Demand curve shifts left Supply curve remains unchanged Axes labeled: Price (vertical) and Quantity (horizontal) Explanation: As demand decreases, the equilibrium price and quantity both fall. ✅ Example #2: Reduced Oil Drilling What’s happening? The government restricts oil drilling, which reduces the supply of oil. This causes the supply curve to shift left (a decrease in supply). Graph features: Supply curve shifts left Demand remains unchanged Axes labeled: Price and Quantity Explanation: With reduced supply, the equilibrium price rises and equilibrium quantity falls. ✅ Example #3: More Millennials Competing for Houses What’s happening? The population of Millennials increases demand for homes. This causes the demand curve to shift right (an increase in demand). Graph features: Demand curve shifts right Supply remains unchanged Axes labeled: Price and Quantity Explanation: With increased demand, the equilibrium price and quantity both rise. See more