Create
Remove BG
Search
Categories
Tutorial
My images
Upgrade to Pro
Help
Pro
Sign up
Retouch
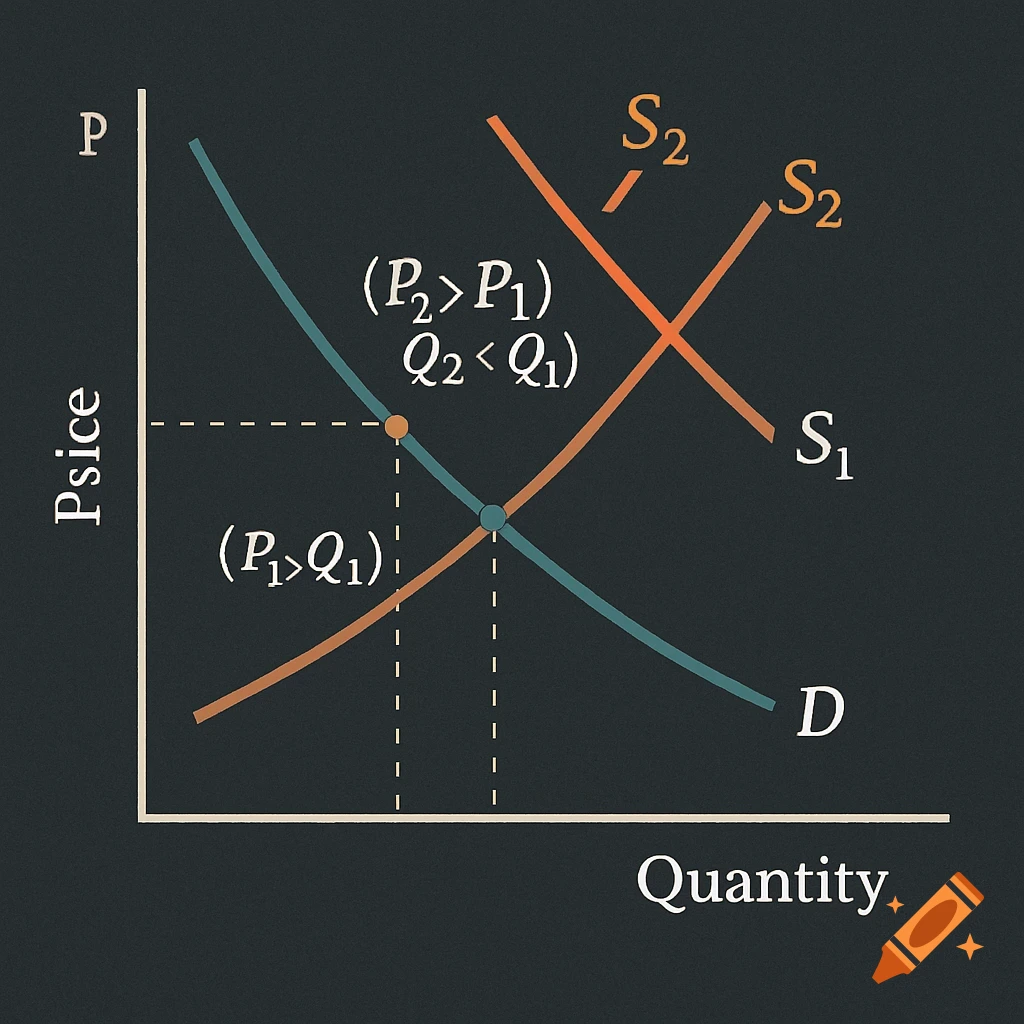
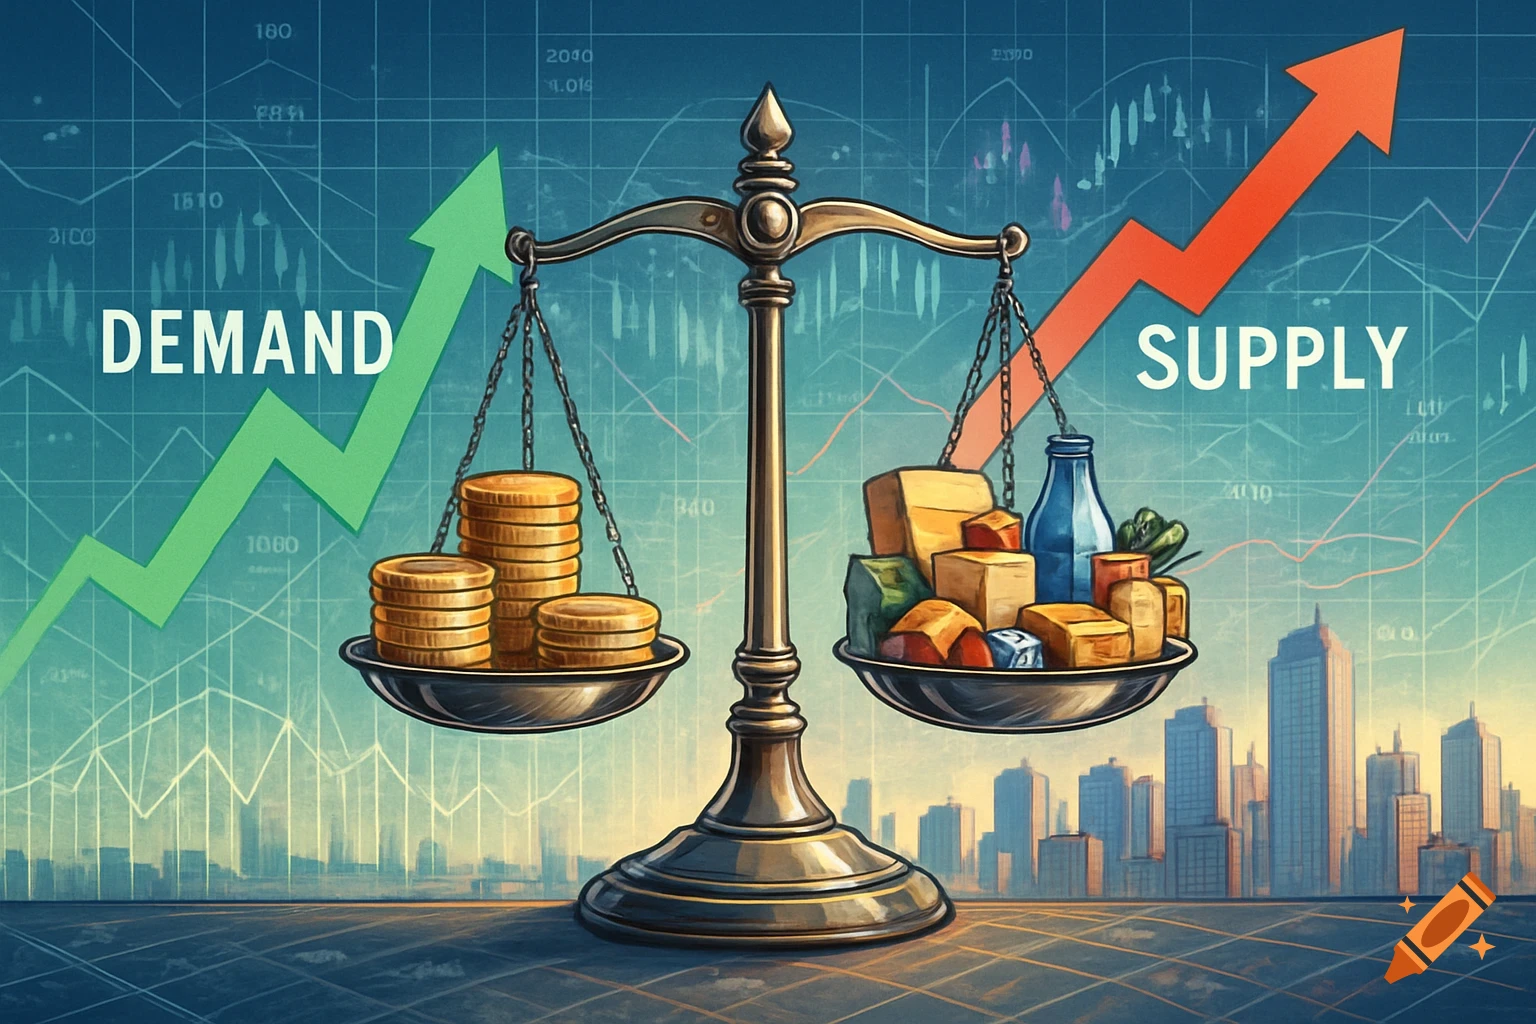
Graph to draw: Price on vertical axis, Quantity on horizontal axis. Draw Demand (D) unchanged. Draw Supply shifting left from S1 to S2. Mark original equilibrium (P1,Q1) and new (P2 > P1, Q2 < Q1). See more
Infos
Get it on a shirt