A flow diagram illustrating CO2e emissions from the Syren Washing Procedure, showing upstream, patient washing, and downstream activities.
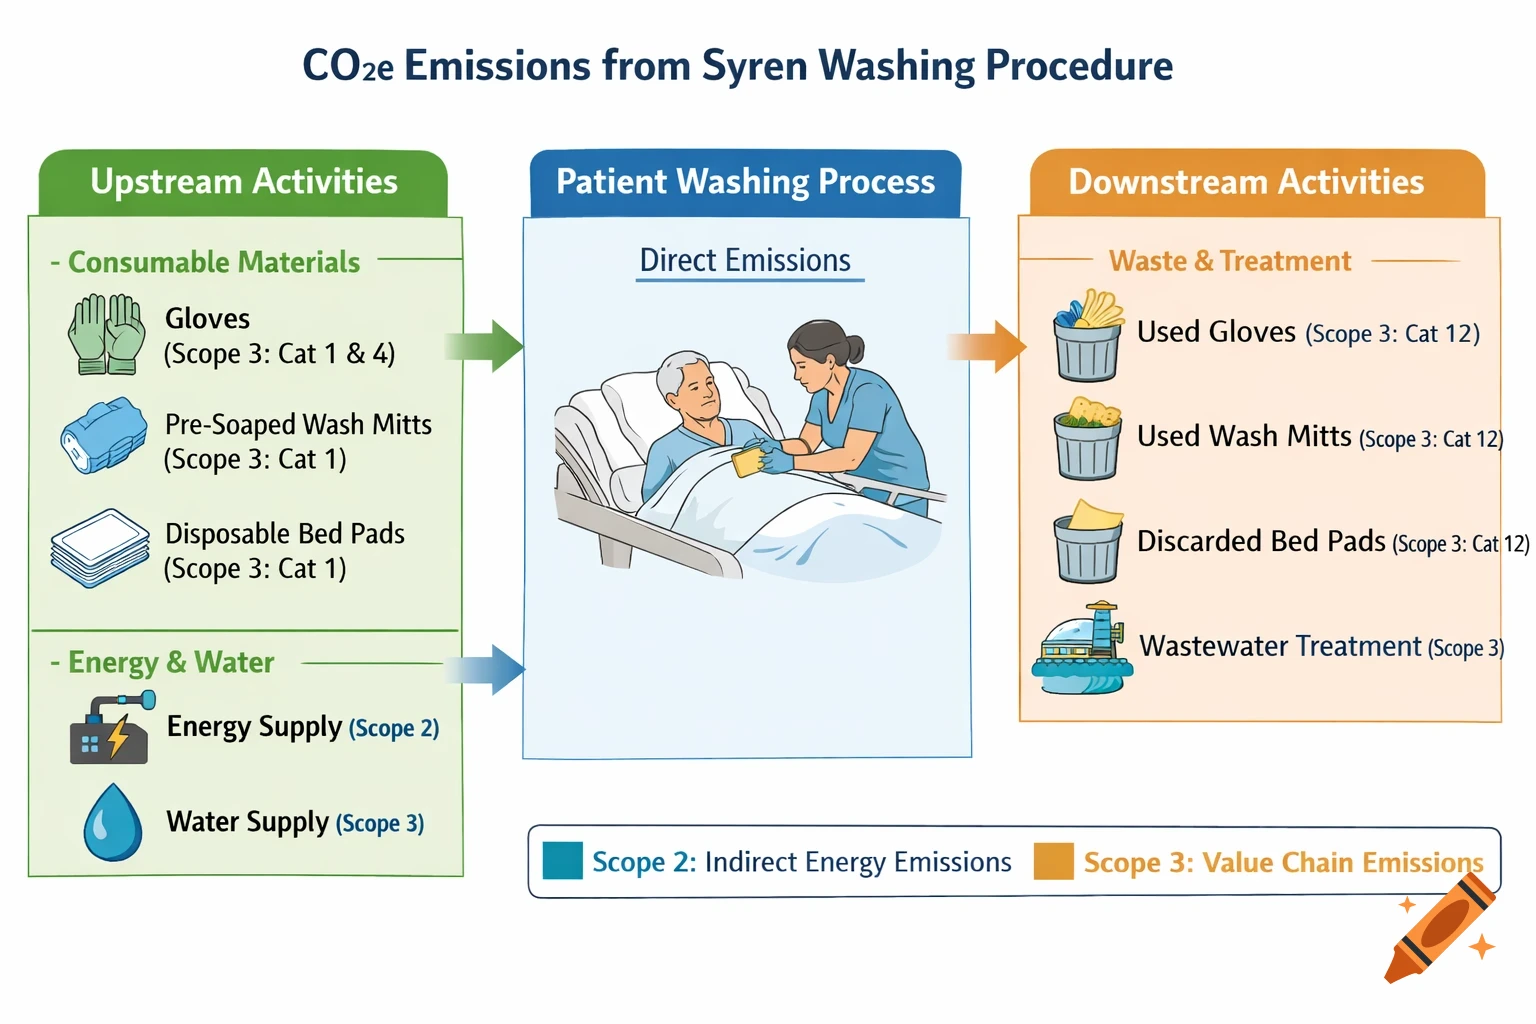
Explain the image in a clear and structured way. The image represents CO₂e emissions related to the Syren Washing Procedure in the healthcare sector, distinguishing between Upstream (left side) and Downstream (right side). Describe: 1. Upstream activities, including consumable materials: gloves (Scope 3: Categories 1 and 4) pre-soaped wash mitts (Scope 3: Category 1) disposable bed pads (Scope 3: Category 1) energy supply (Scope 2) water supply (Scope 3) 2. The central patient washing activity (operational process). 3. Downstream activities, including: used gloves (Scope 3: Category 12) used pre-soaped wash mitts (Scope 3: Category 12) discarded disposable bed pads (Scope 3: Category 12) wastewater treatment (Scope 3) Highlight how the image links the healthcare process to greenhouse gas emissions, showing which phases fall under Scope 2 and which under Scope 3, with particular attention to the value chain logic. It is important that for each item you also indicate the Scope and, where applicable, the Category it belongs to. Use simple language, suitable for a non-technical audience interested in sustainability and ESG reporting. See more