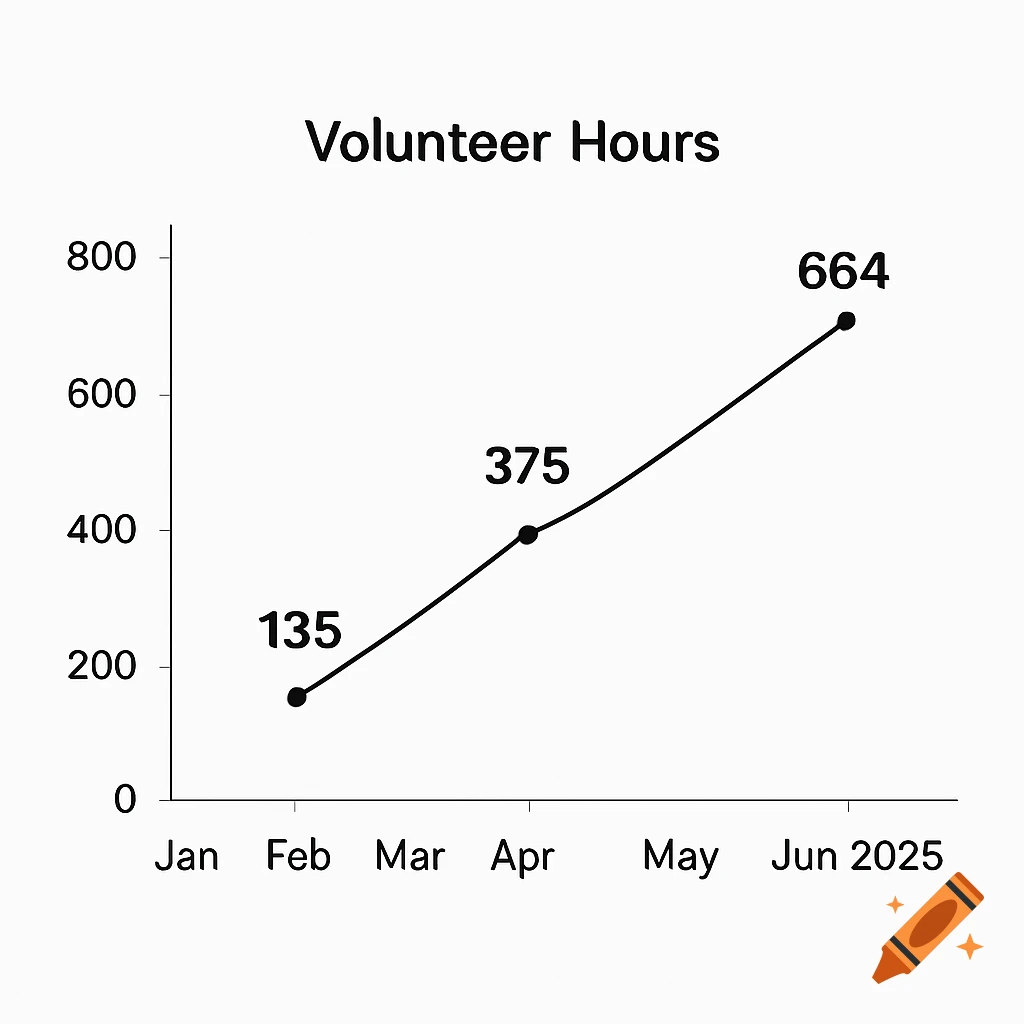
Bar chart showing total percentage of diabetes by age range.
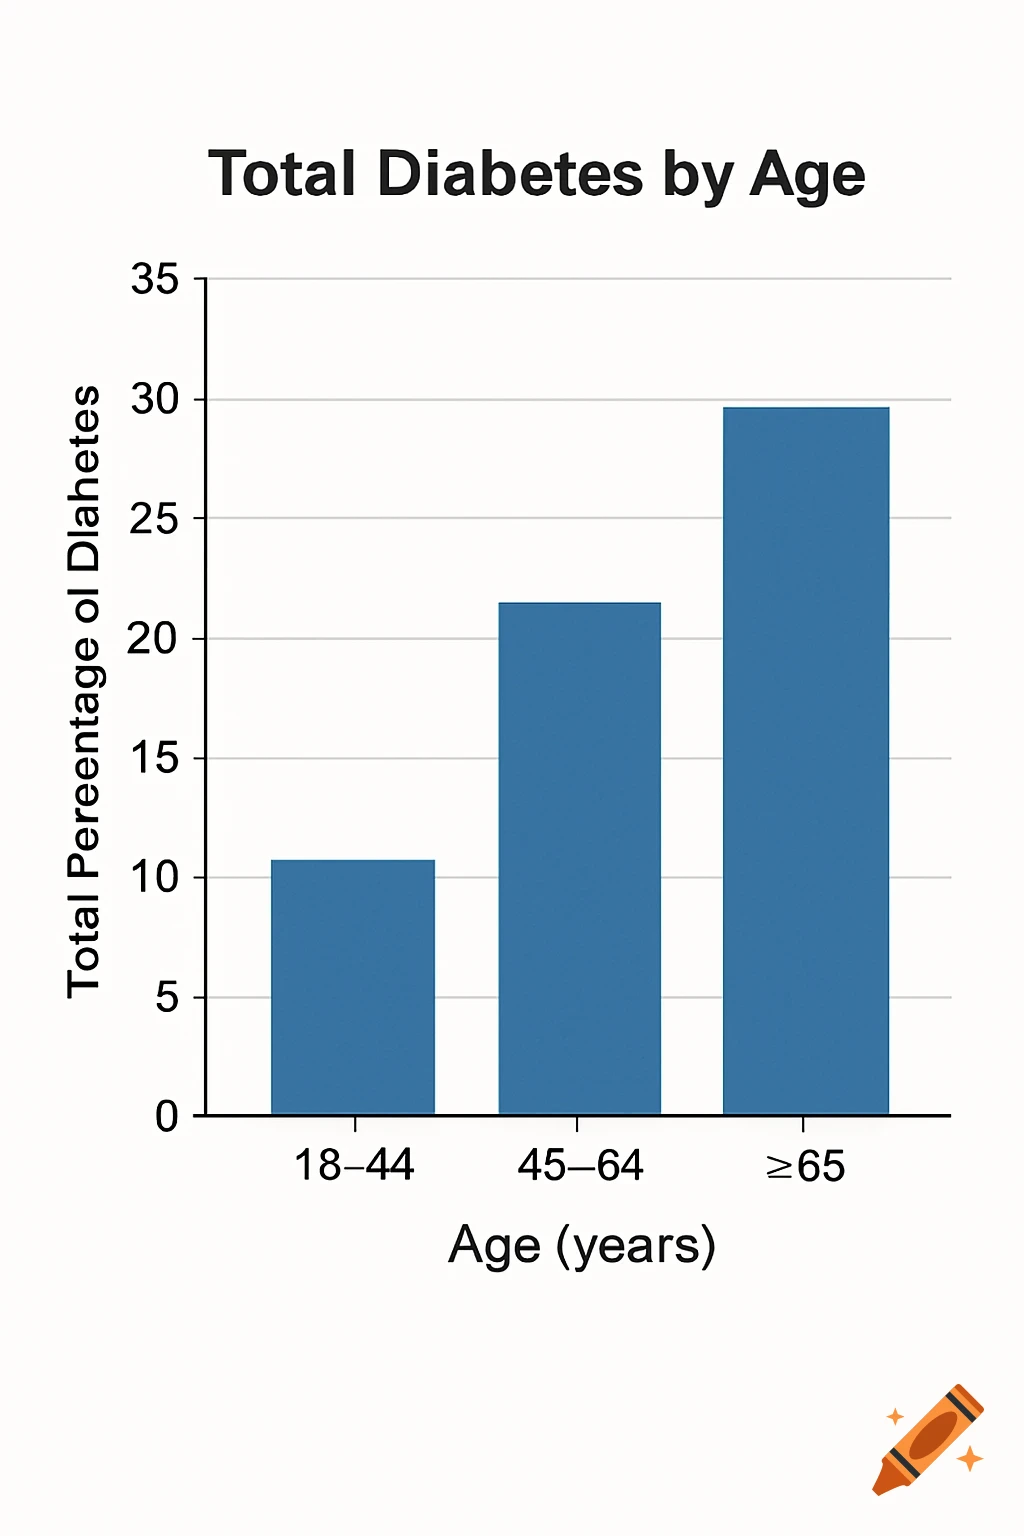
) Create a graphical representation based on Table 1a that illustrates the relationship between various age ranges and the corresponding total percentage of diabetes. Ensure that the graph includes clearly labeled x- and y-axes, and provide an appropriate, descriptive title for the graph. Characteristic Diagnosed diabetes Percentage (95% CI) Undiagnosed diabetes Percentage (95% CI) Total diabetes Percentage (95% CI) Total 11.3 (10.3–12.5) 3.4 (2.7–4.2) 14.7 (13.2–16.4) Age in years 18–44 3.0 (2.4–3.7) 1.9 (1.3–2.7) 4.8 (4.0–5.9) 45–64 14.5 (12.2–17.0) 4.5 (3.3–6.0) 18.9 (16.1–22.1) ≥65 24.4 (22.1–27.0) 4.7 (3.0–7.4) 29.2 (26.4–32.1) Sex Men 12.6 (11.1–14.3) 2.8 (2.0–3.9) 15.4 (13.5–17.5) Women 10.2 (8.8–11.7) 3.9 (2.7–5.5) 14.1 (11.8–16.7) Race-Ethnicity White, non-Hispanic 11.0 (9.4–12.8) 2.7 (1.7–4.2) 13.6 (11.4–16.2) Black, non-Hispanic 12.7 (10.7–15.0) 4.7 (3.3–6.5) 17.4 (15.2–19.8) Asian, non-Hispanic 11.3 (9.7–13.1) 5.4 (3.5–8.3) 16.7 (14.0–19.8) Hispanic 11.1 (9.5–13.0) 4.4 (3.3–5.8) 15.5 (13.8–17.3) See more