Graph showing Investment in Youth Academy vs Star Players Signed with points A, B, and C on a curve.
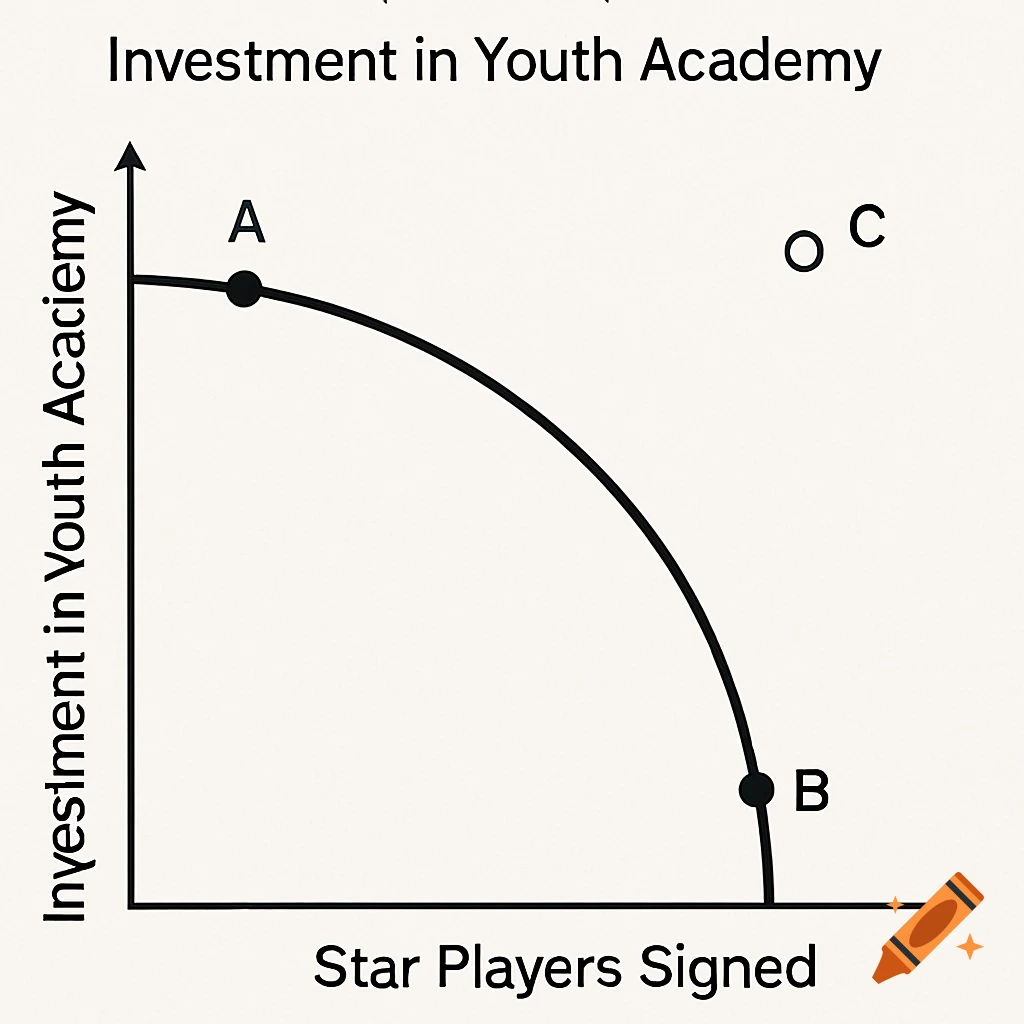
1. Production Possibilities Curve (PPC) Concept: Opportunity Cost & Scarcity Graph Label: X-Axis: Star Players Signed Y-Axis: Investment in Youth Academy Explanation: A PPC curve shows the trade-off Real Madrid faces: spending more on signing top players limits investment in developing youth talent — and vice versa. Visual Tip: Show two points: Point A (more youth investment, fewer stars) Point B (more stars, less youth development) Use a point outside the curve to show an unattainable combo due to scarcity. See more