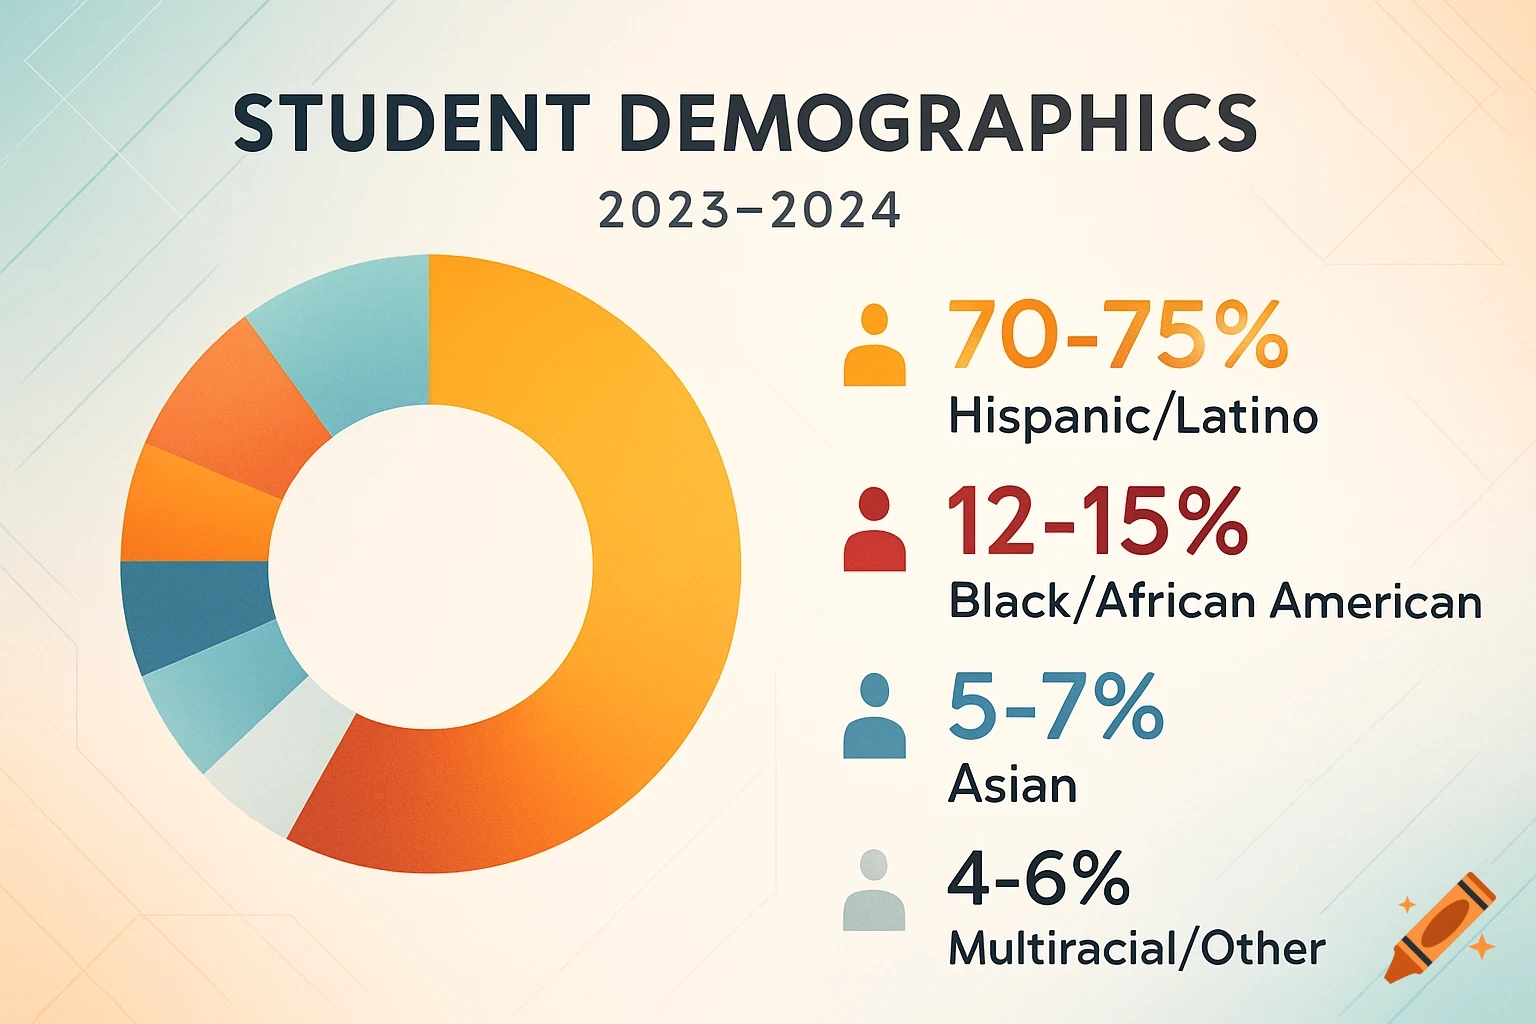
An infographic showing proportional representation with colorful circles. Blue, red, green, and yellow circles represent seats for parties A, B, C, and D, with seat counts 34, 29, 21, and 16 respectively.
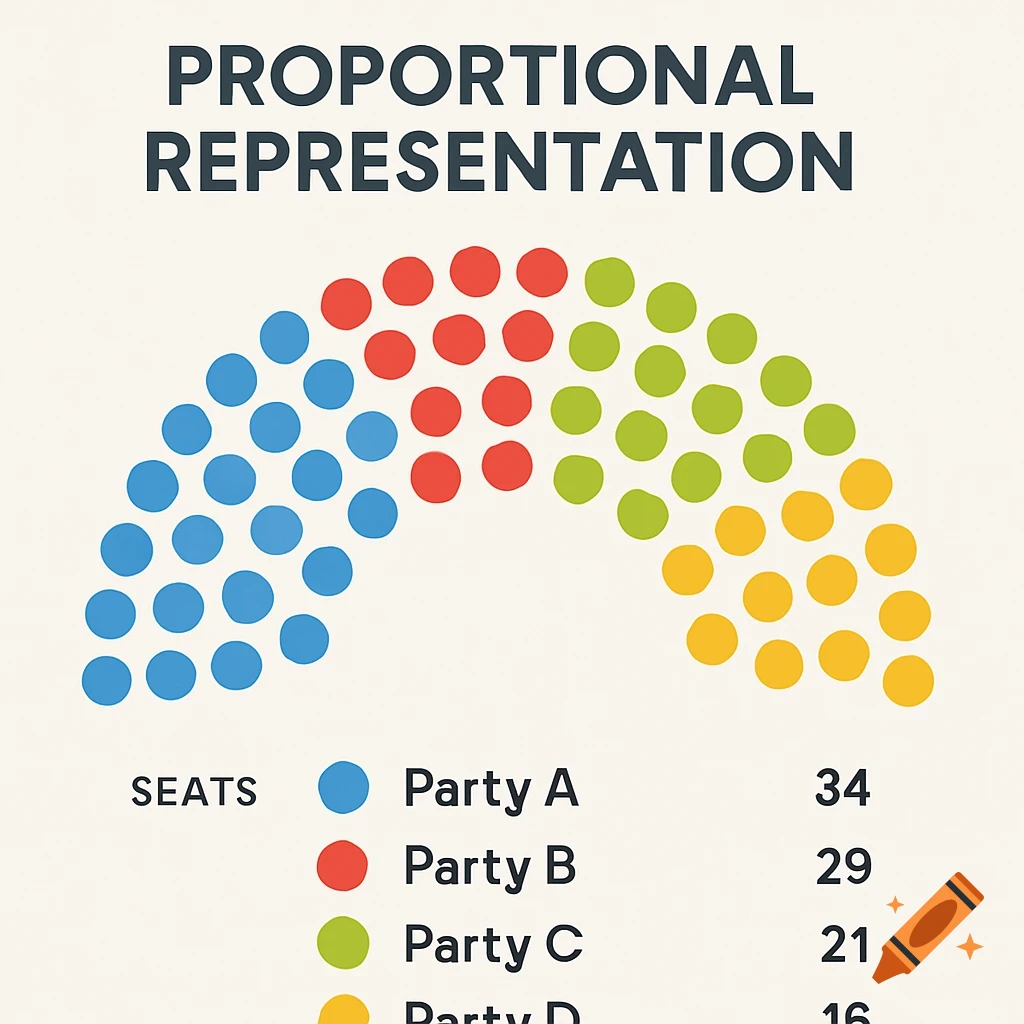
"Create a simple, clear, and pedagogical infographic illustrating a proportional representation voting system. Use colorful circles or bubbles to represent seats in parliament. Show how different parties receive seats proportional to the percentage of votes they get. Make it easy to understand for students, visually appealing, and suitable for classroom use. Include labels for parties and number of seats." See more