A conceptual diagram with orange ovals labeled "Survey Queries", "Students", "Category", "Decision Points", and blue cubes with numbers 5, 8, 1, on a dark textured background with a line graph.
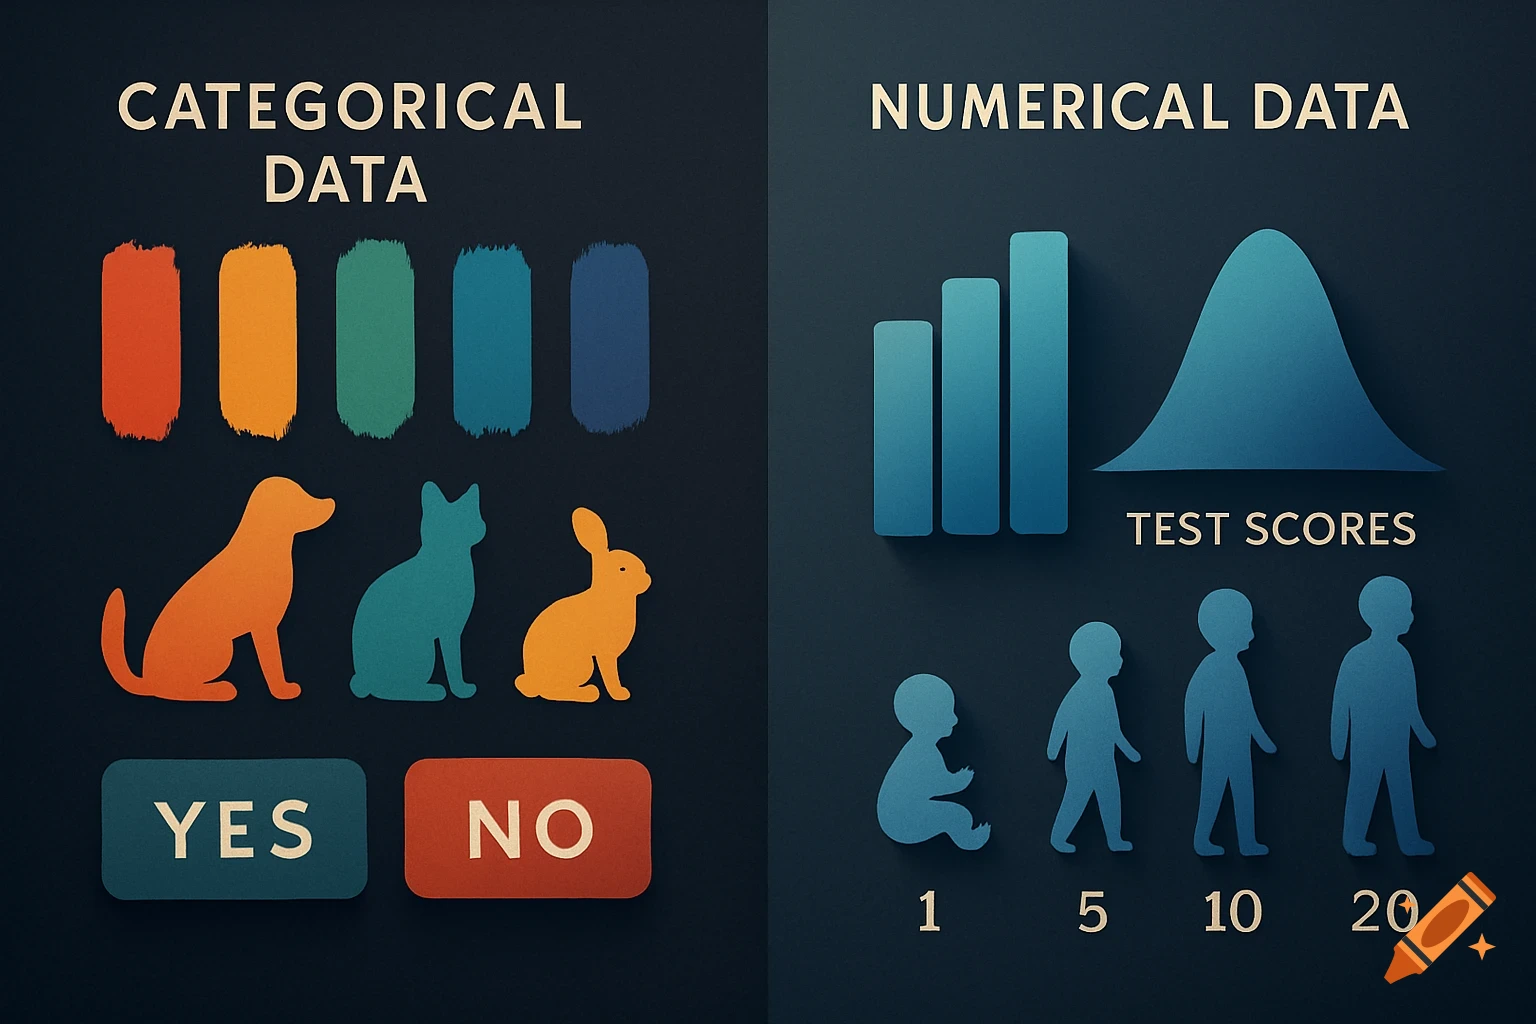
Categorical data are labels or groups (favorite color, type of pet, yes/no answers). Numerical data are numbers you can measure or count (ages, test scores, number of books). What it looks like: When students see a survey question, they decide if the responses are categories (words) or numbers (quantities) See more