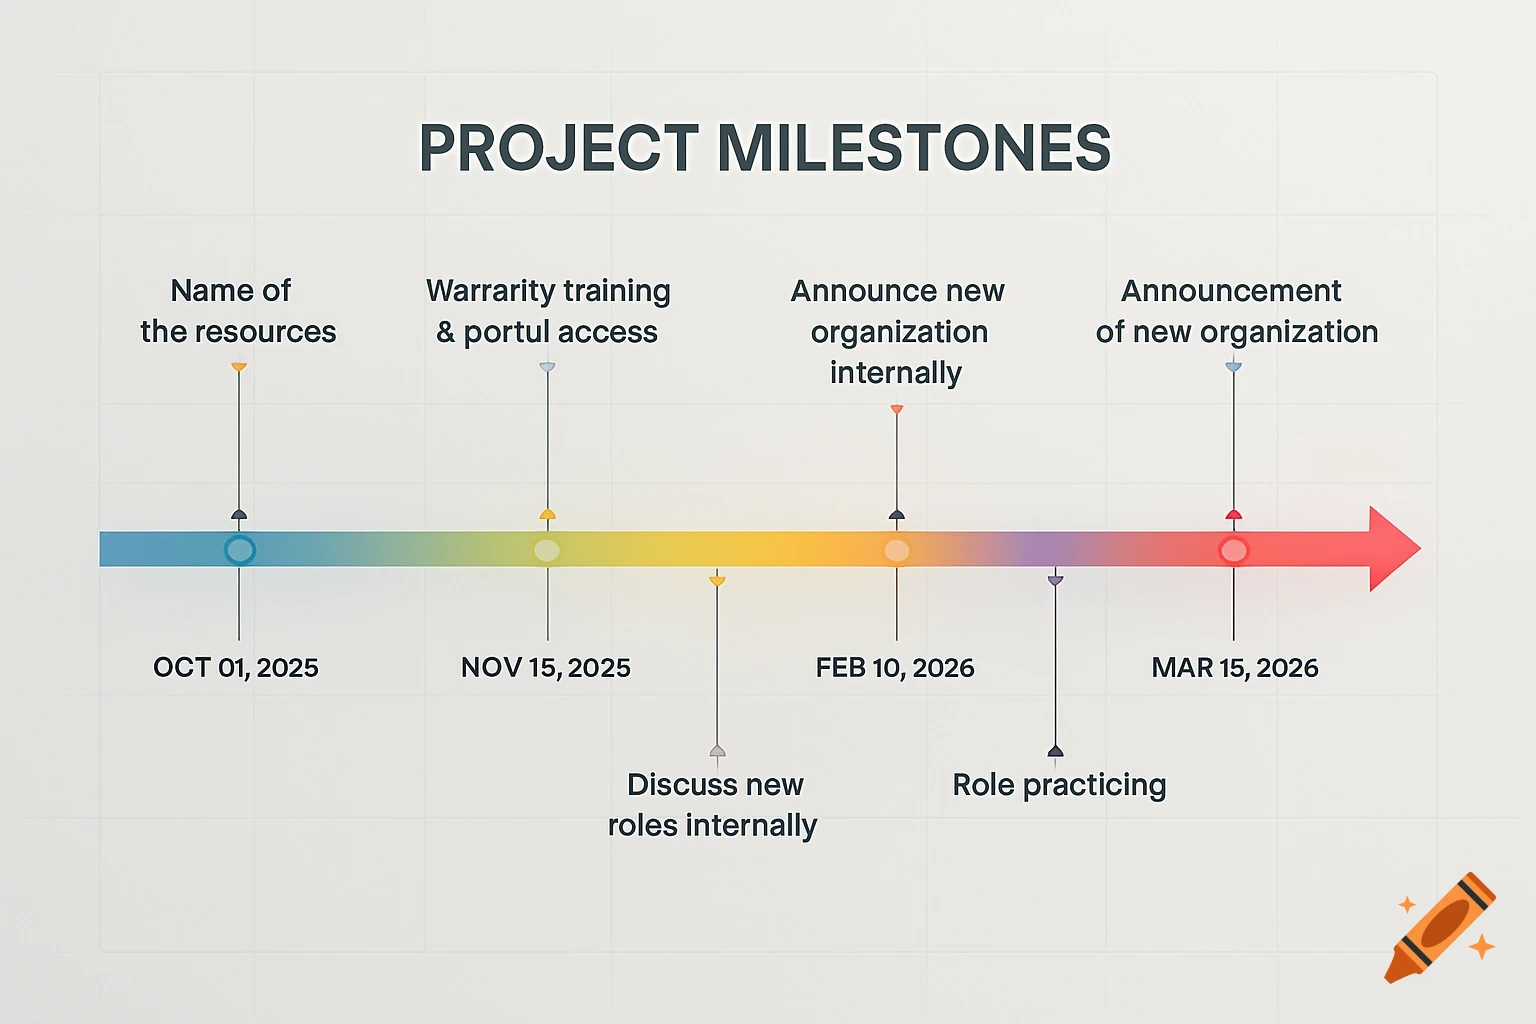
Professional project timeline graphic showing milestones from July to December 2025.
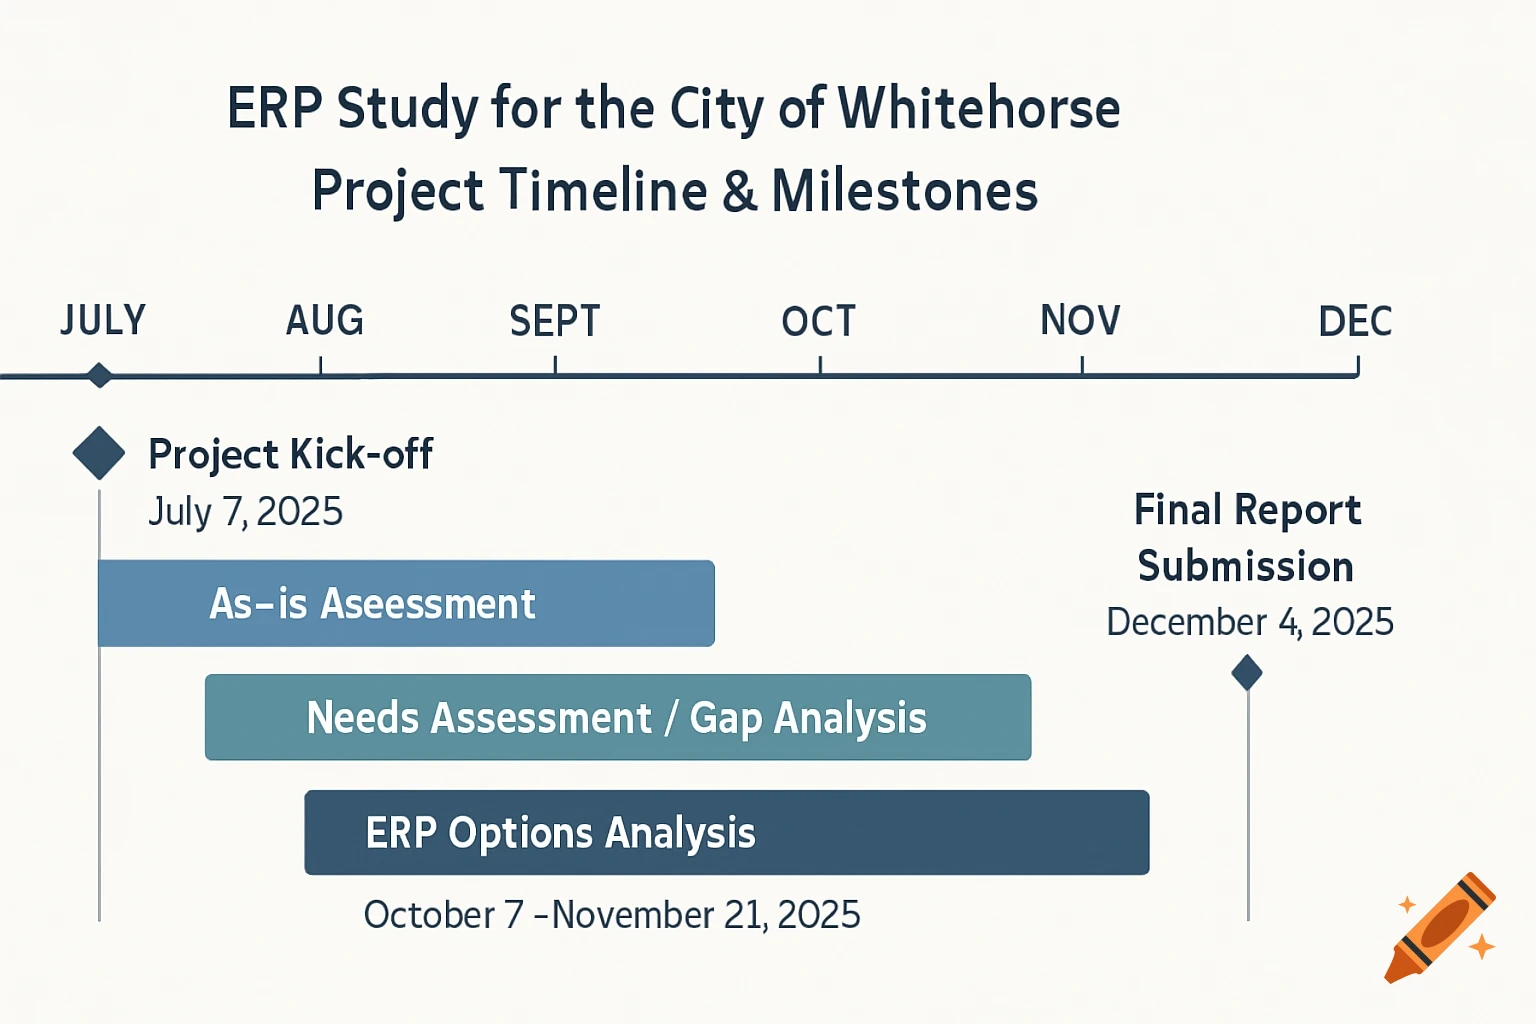
ERP Study for the City of Whitehorse - Project Timeline & Milestones The visual was a horizontal timeline graphic, designed to be clear, professional, and easy to understand at a glance, perfect for a proposal. Overall Layout: It would have been structured as a Gantt-chart style timeline but simplified for a proposal, focusing on key milestones and activity durations rather than detailed task dependencies. The timeline would run from left to right, representing the progression of time from July 2025 to December 2025. A main horizontal bar or line would serve as the central axis of the timeline. Key Elements and Their Appearance: Project Phases/Activities (Bars): Each major project phase (e.g., "As-Is Assessment," "Needs Assessment/Gap Analysis," "ERP Options Analysis") would be represented by a colored horizontal bar spanning its duration. These bars would be clearly labeled with the phase name (e.g., "As-Is Assessment") and the start and end dates (e.g., "July 10 - August 7, 2025"). The bars would likely be in a professional, muted color palette (e.g., different shades of blue, gray, or green) to differentiate phases without being distracting. Milestones (Markers/Diamonds): Key deliverables and specific events (e.g., "Project Kick-off," "Mid-Project Review," "Final Report Submission") would be marked with distinct icons along the timeline. These might be: Diamonds Circles Vertical lines with flags Each milestone marker would have its name (e.g., "Project Kick-off") and the See more