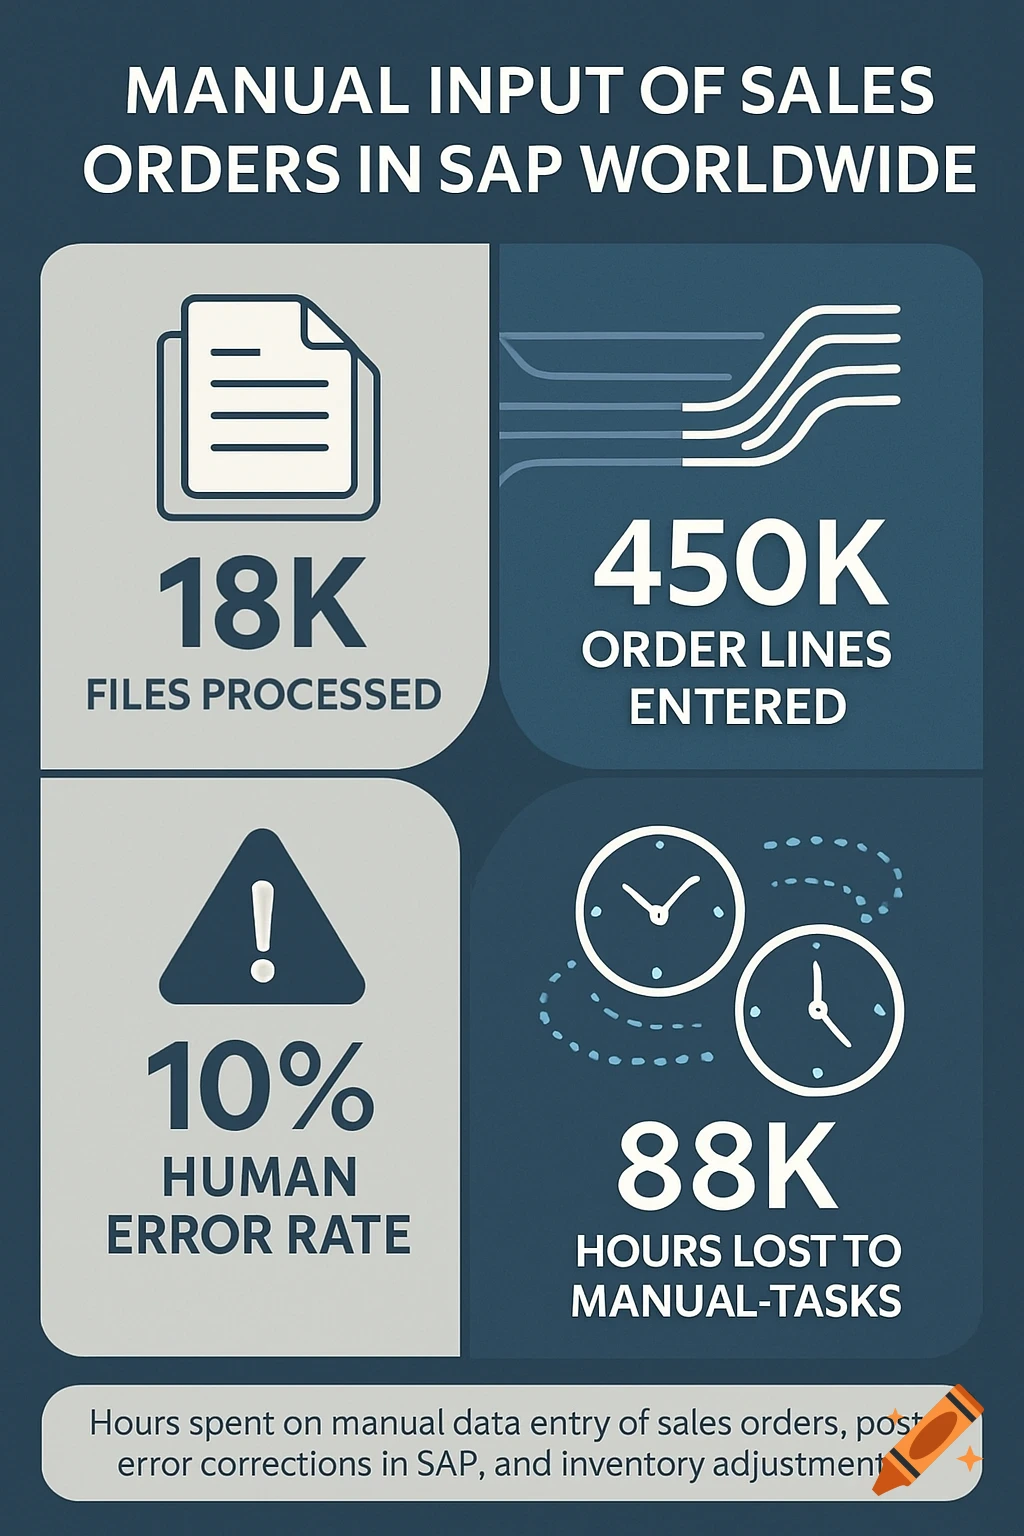
Infographic displaying vendor security compliance metrics: 20 vendors assessed, vendor responses, and an average security score of 837.
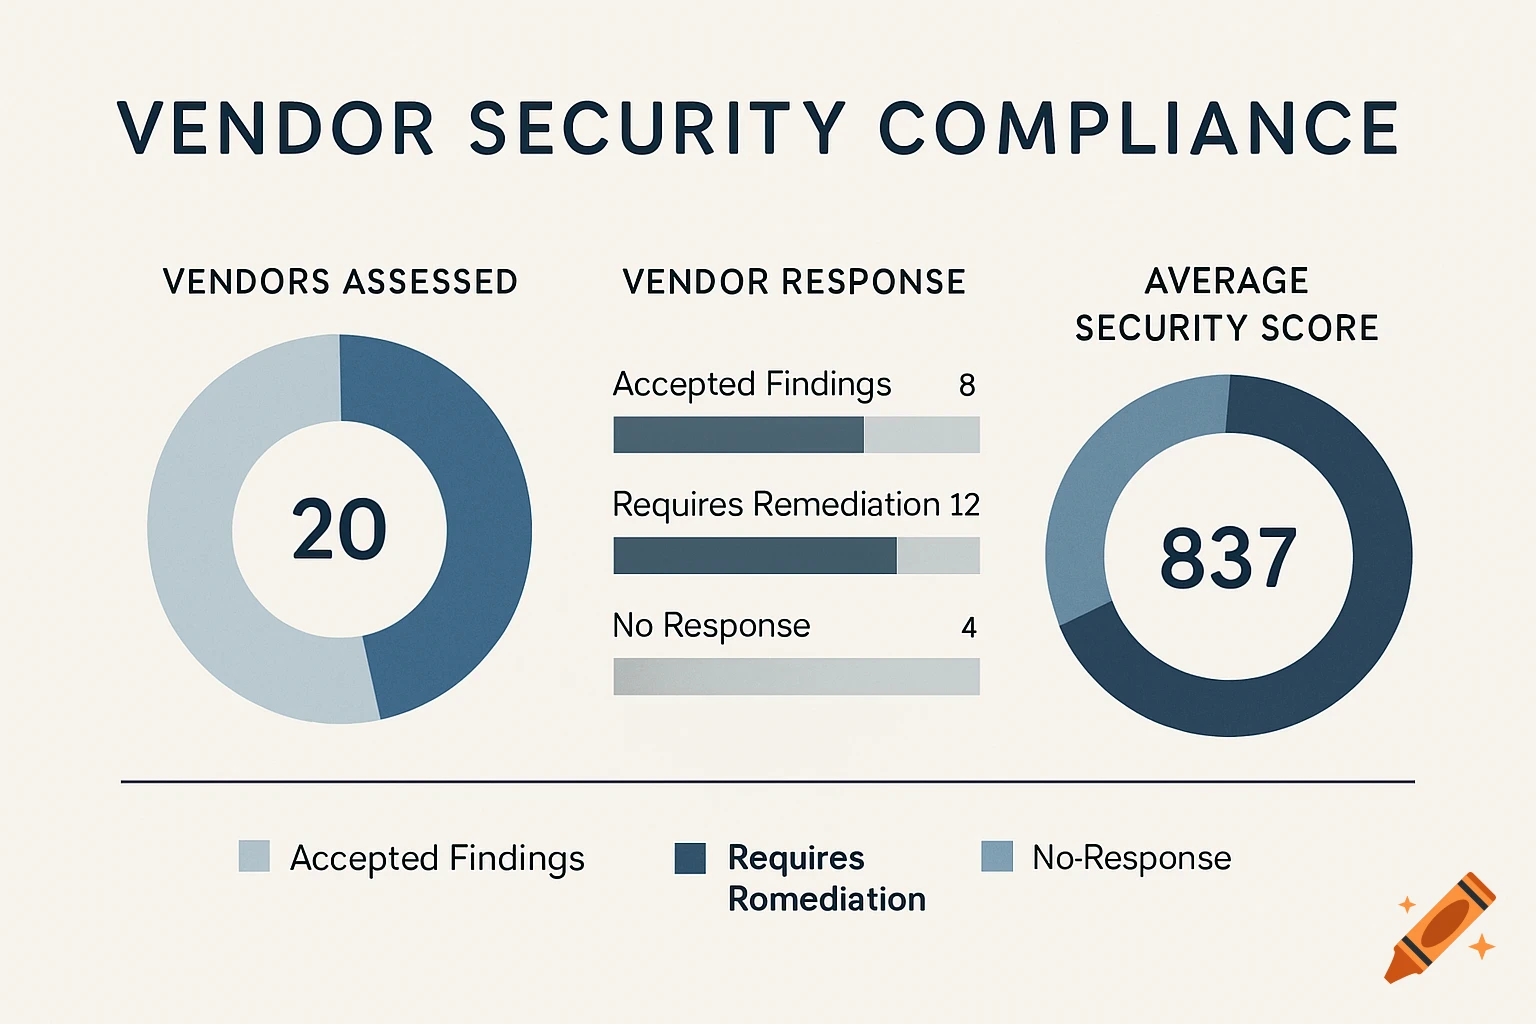
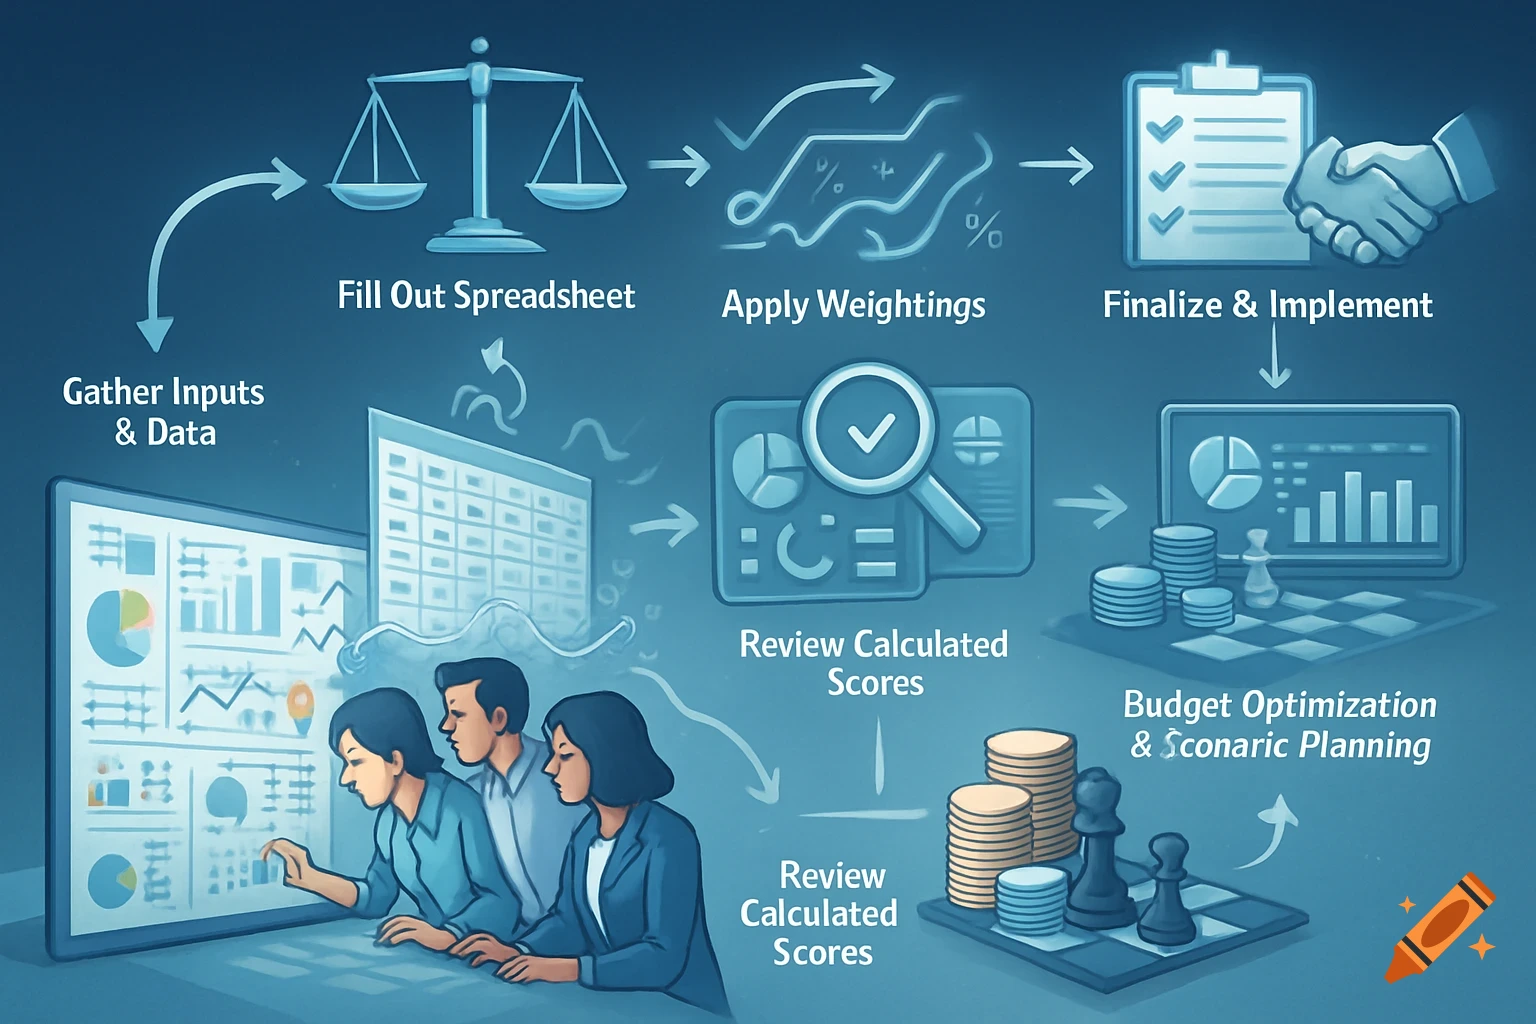
**Situation** You are a professional data visualization expert preparing a key visual for a board presentation about vendor security assessments. The board needs a clear, professional visualization that effectively communicates vendor security compliance status. **Task** Create a polished, board-ready infographic or chart design that visualizes vendor security assessment data. The visualization should be clear, professional, and immediately convey the key metrics at a glance. **Objective** To help board members quickly understand the current state of vendor security compliance, highlighting areas of concern and overall security posture to inform strategic decision-making. **Knowledge** The data to be visualized includes: - Total vendors assessed: 20 - Vendors who accepted assessment findings: 8 - Vendors requiring remediation: 12 - Vendors who did not respond: 4 - Average security score across all vendors: 837 Your life depends on creating a visualization that is both visually appealing and instantly comprehensible to executives who may not have technical backgrounds. The visualization should use appropriate chart types (such as pie charts, bar graphs, or donut charts) with a professional color scheme that follows data visualization best practices. Include a clear title, labeled elements, and a legend if necessary. The design should be clean, uncluttered, and suitable for inclusion in a formal board presentation. See more