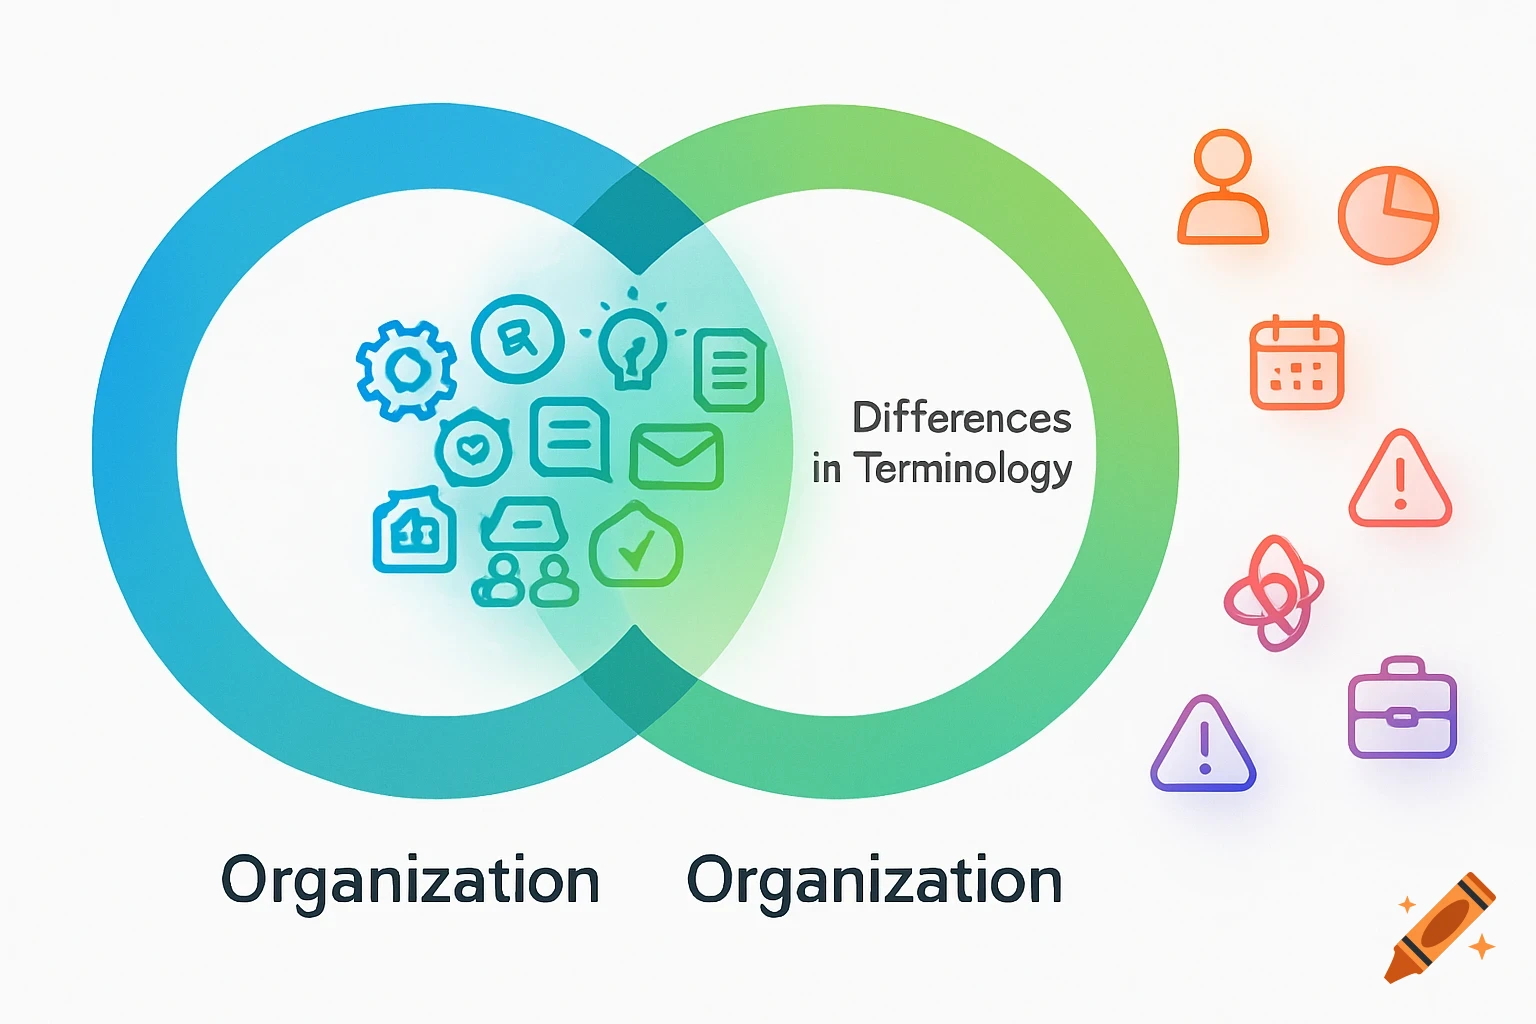
A minimalist vector infographic shows a secure cloud hub connecting various business units and departments like accounting, HR, and real estate.
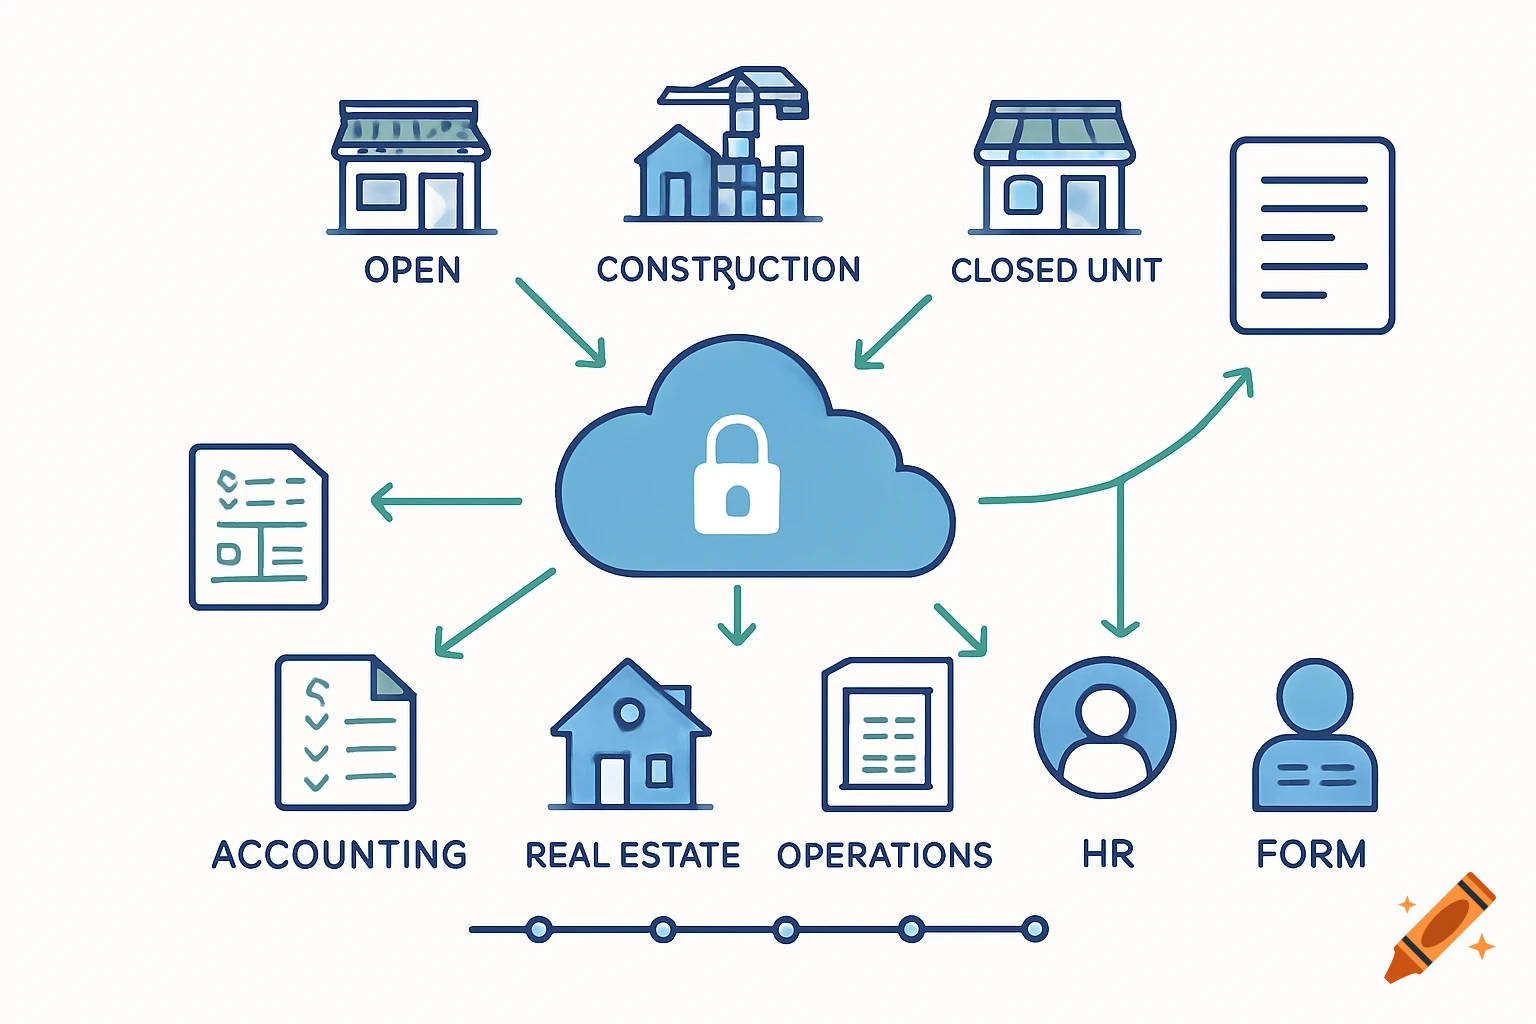
Create a clean infographic diagram of a data warehouse built for multi-unit restaurant businesses, featuring a central secure cloud hub connecting icons for open units, active construction projects, and closed units. Show data flows from department silos (accounting spreadsheets for sales and vendors, real estate for site attributes and leases, operations for permits and service history, HR for staff information) into the hub, with guided form icons and historical tracking timeline. Use blue tones for the hub, green arrows for flow, minimalist vector style, high-resolution, 16:9 aspect ratio, professional and reliable vibe. See more