An academic diagram illustrating multimodal data time alignment for pharmaceutical granulation, showing image and process data streams synchronized over a unified time axis.
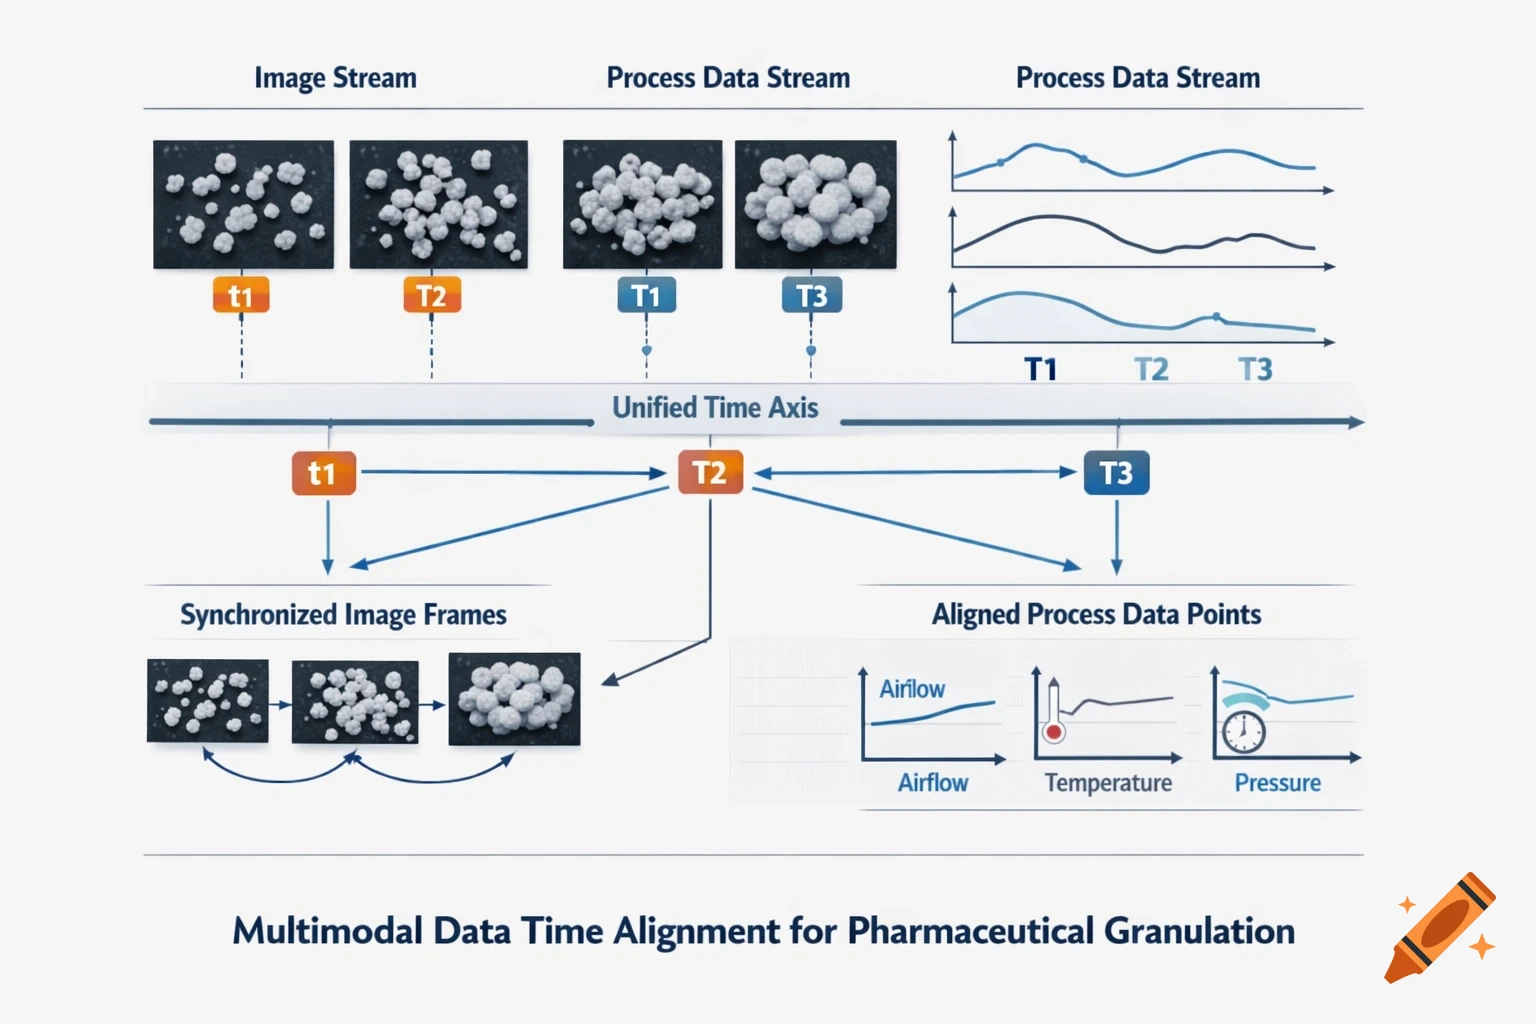
A highly detailed academic diagram of a multimodal data time alignment process for pharmaceutical granulation analysis. The diagram should follow an isometric and schematic style, with a clean, minimalistic layout suitable for a top-tier academic journal. Main color palette: blue, gray, and orange tones for different data streams and components. The diagram is divided into multiple sections: 1. **Data Streams**: - The upper section shows **multiple input data streams**, labeled "图像流" (Image Stream), "工艺数据流" (Process Data Stream), and "统一时间轴" (Unified Time Axis). The input data streams consist of high-speed camera images and process data (e.g., airflow, temperature, pressure). - **High-speed camera images** (颗粒图像) displayed in circular and short-rod particle shapes with clear boundaries, scattered across the image. These should not resemble dog food shapes, but typical pharmaceutical granules. - **Process data curves** for airflow, temperature, and pressure, represented as clean line graphs with discrete timestamps. 2. **Time Alignment Process**: - In the center, arrows indicate the alignment of image frames with process data over time. - **Time Timestamps**: Labels in orange for image frame timestamps (e.g., "t1", "t2", "t3") and blue for process data timestamps (e.g., "t1", "t2", "t3"). A timeline flows horizontally, marked with "统一时间轴" (Unified Time Axis). - The diagram should include a visual representation of the alignment process, showing that image frames and process See more