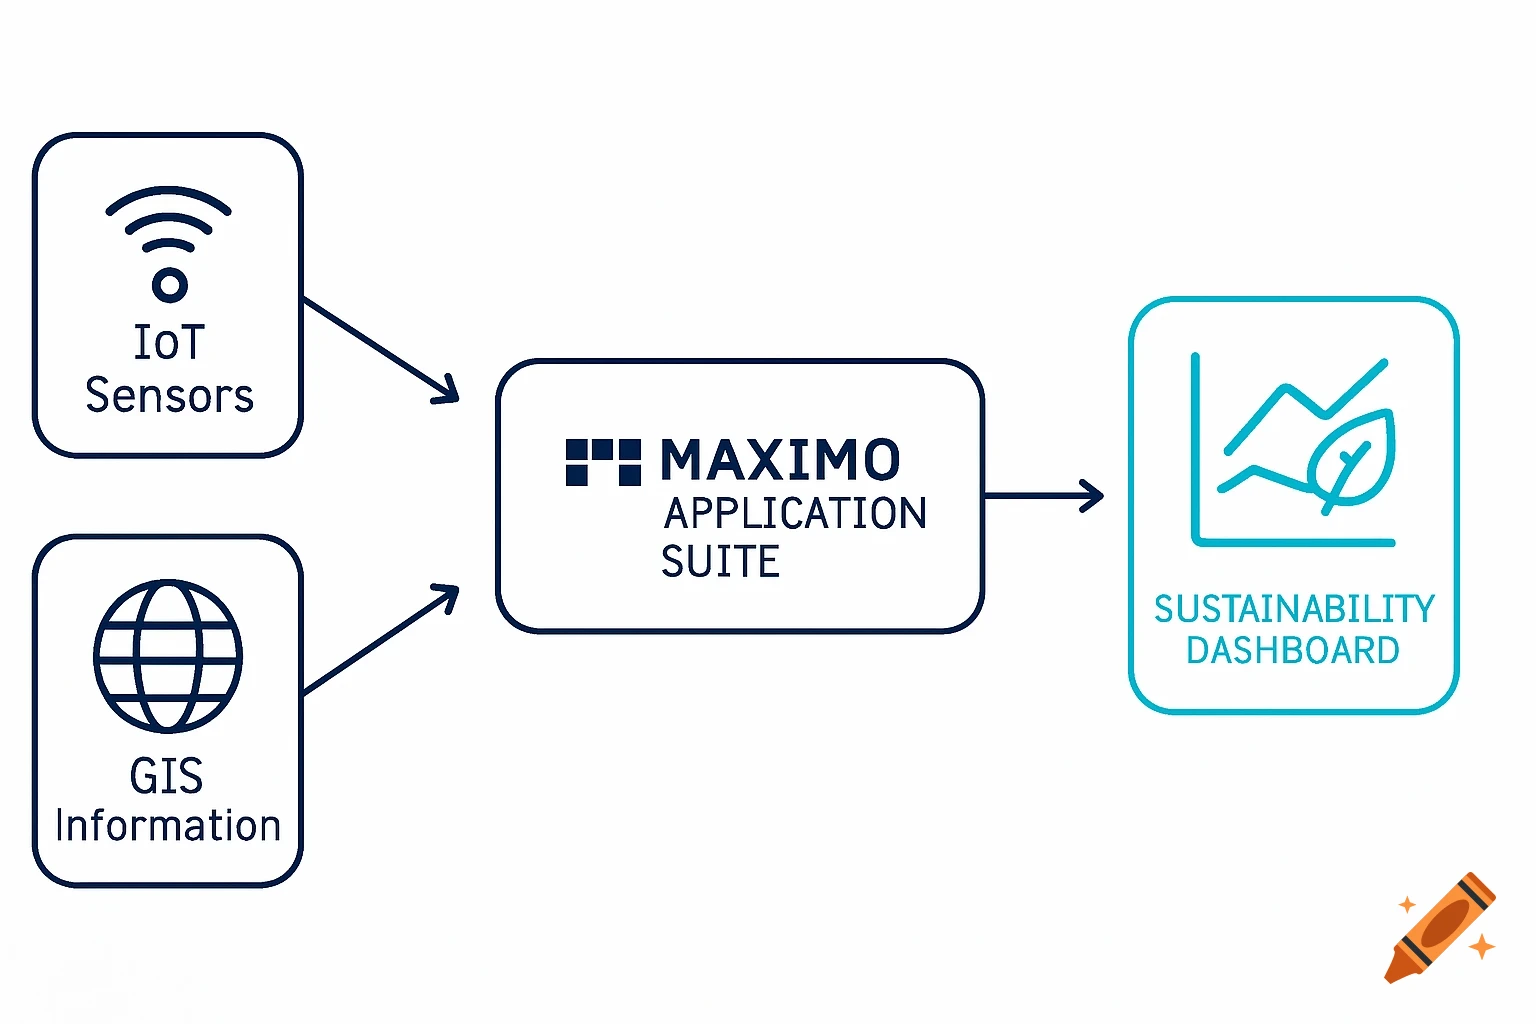
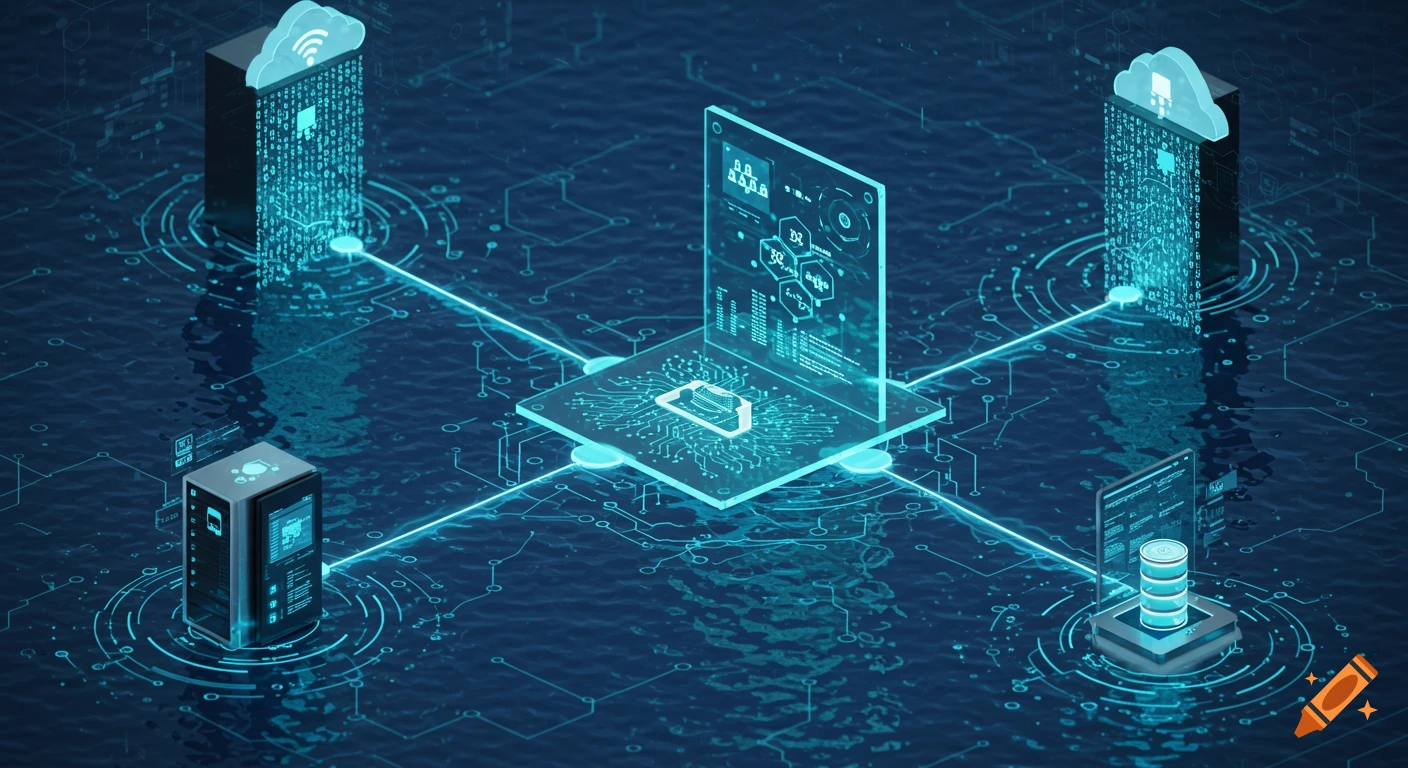
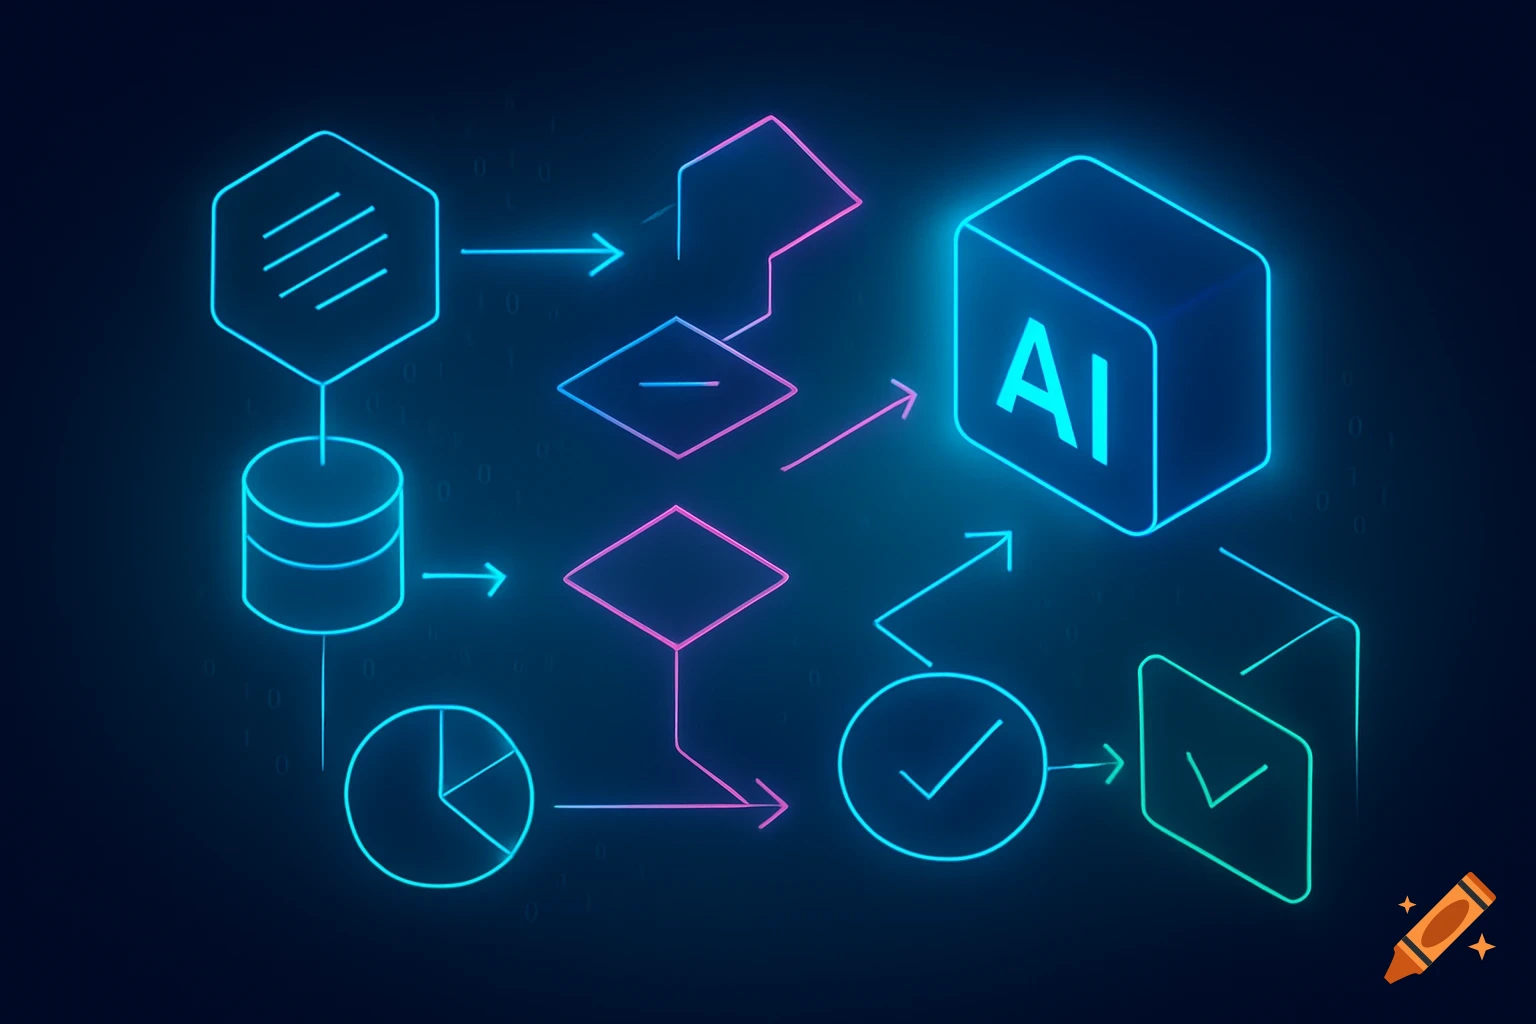
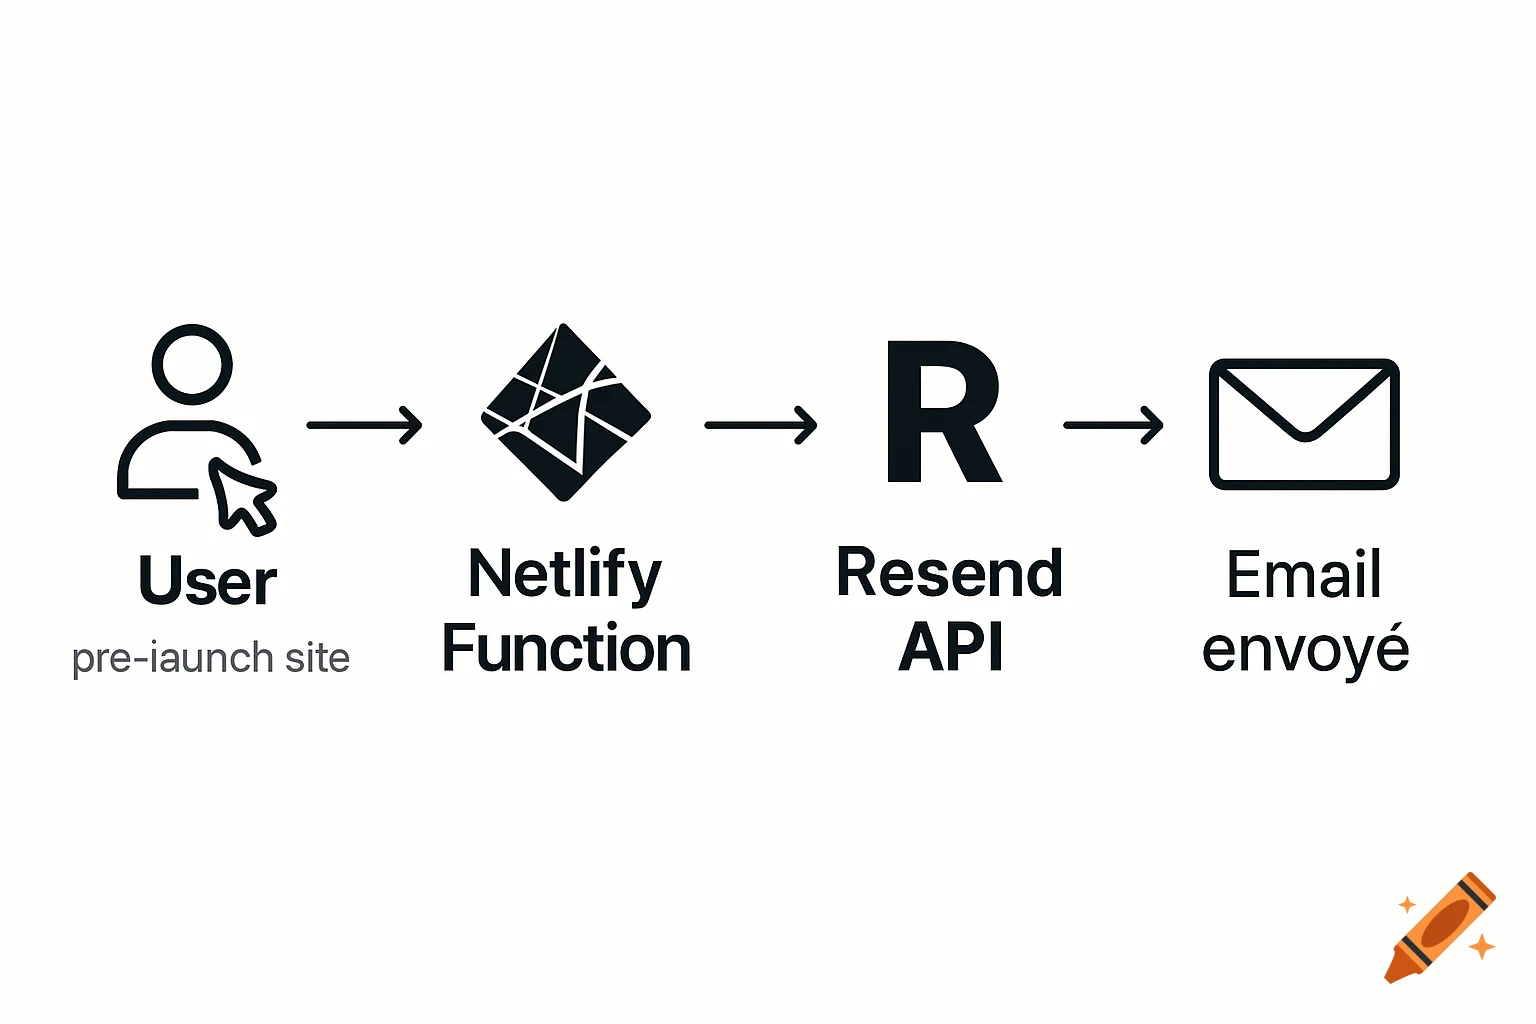
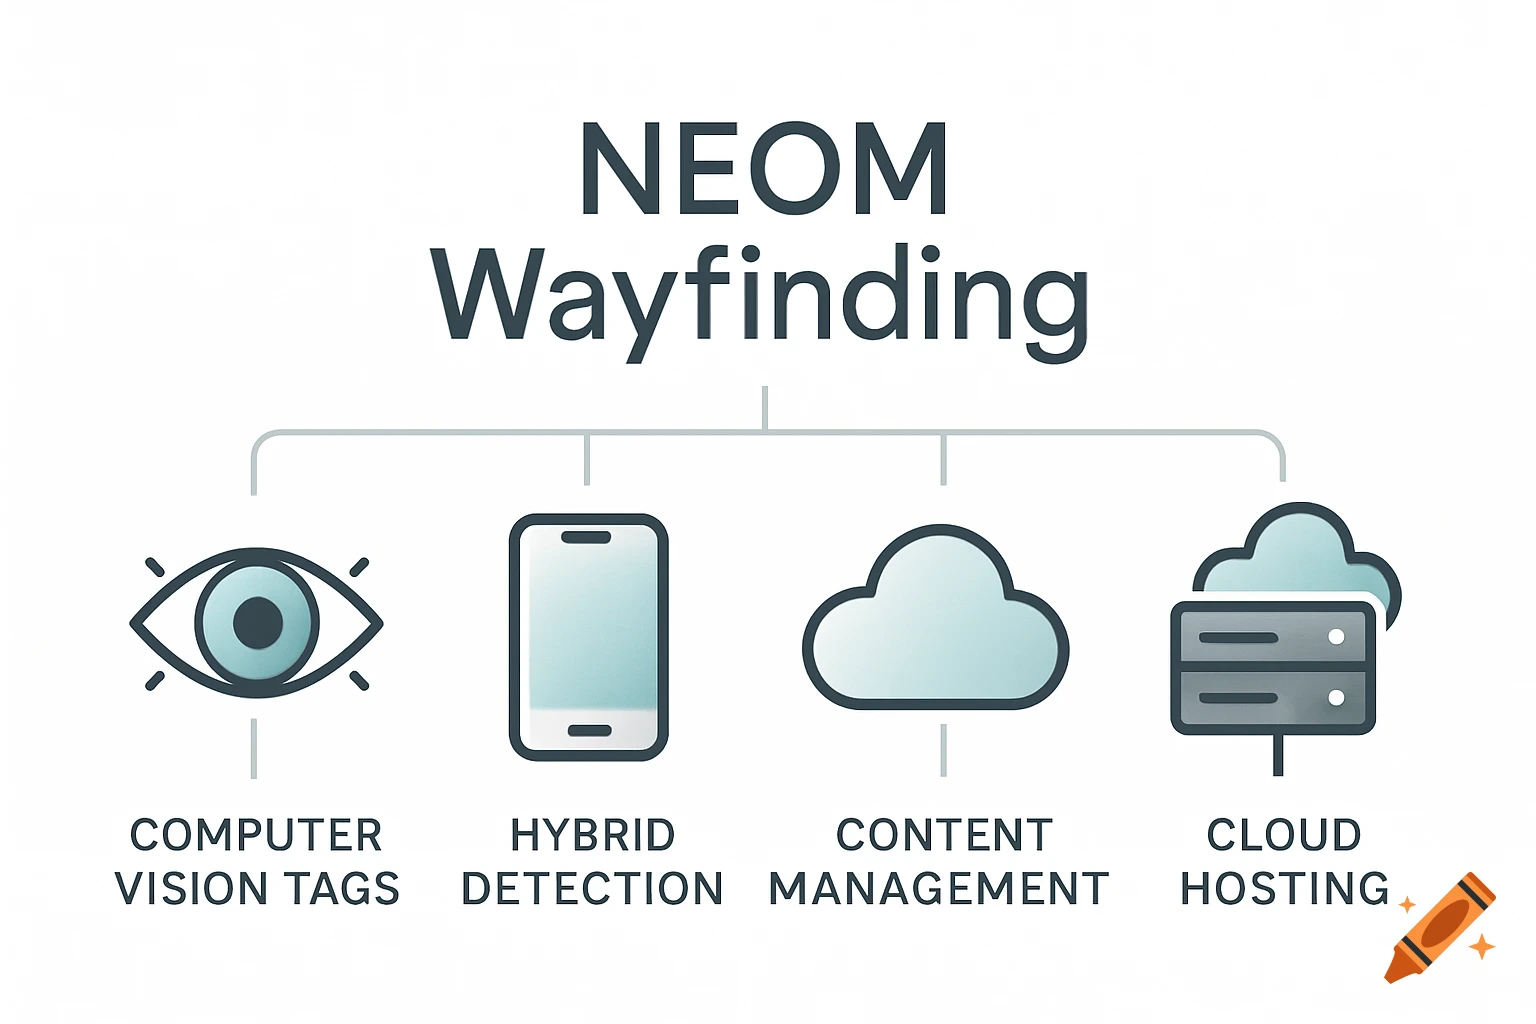
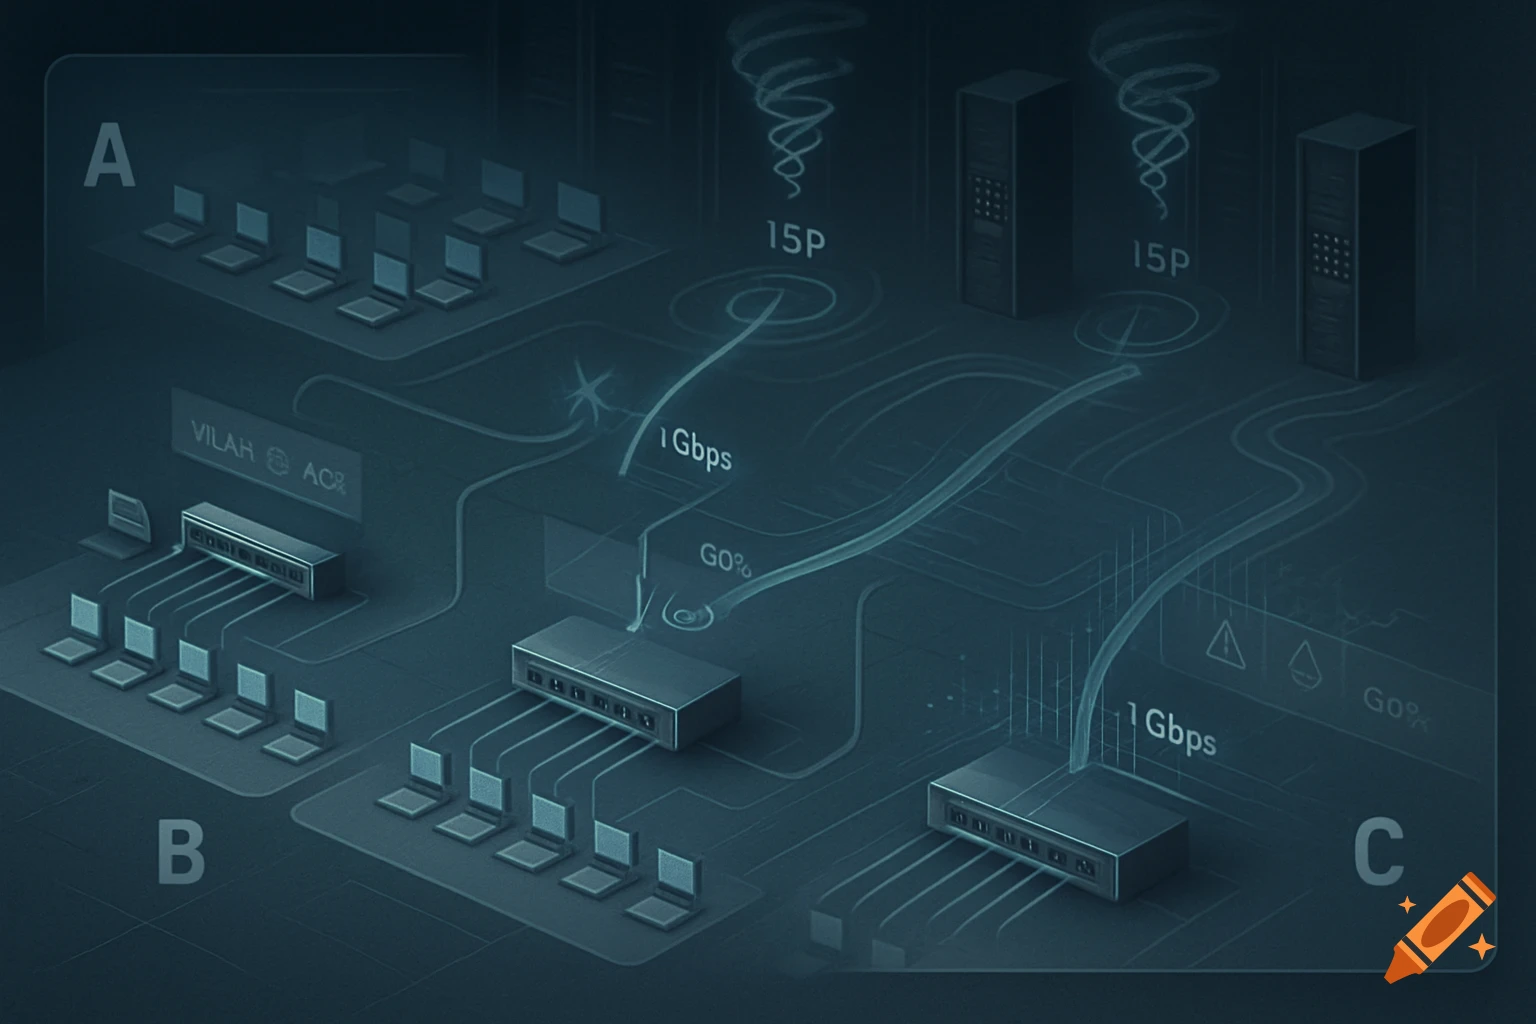
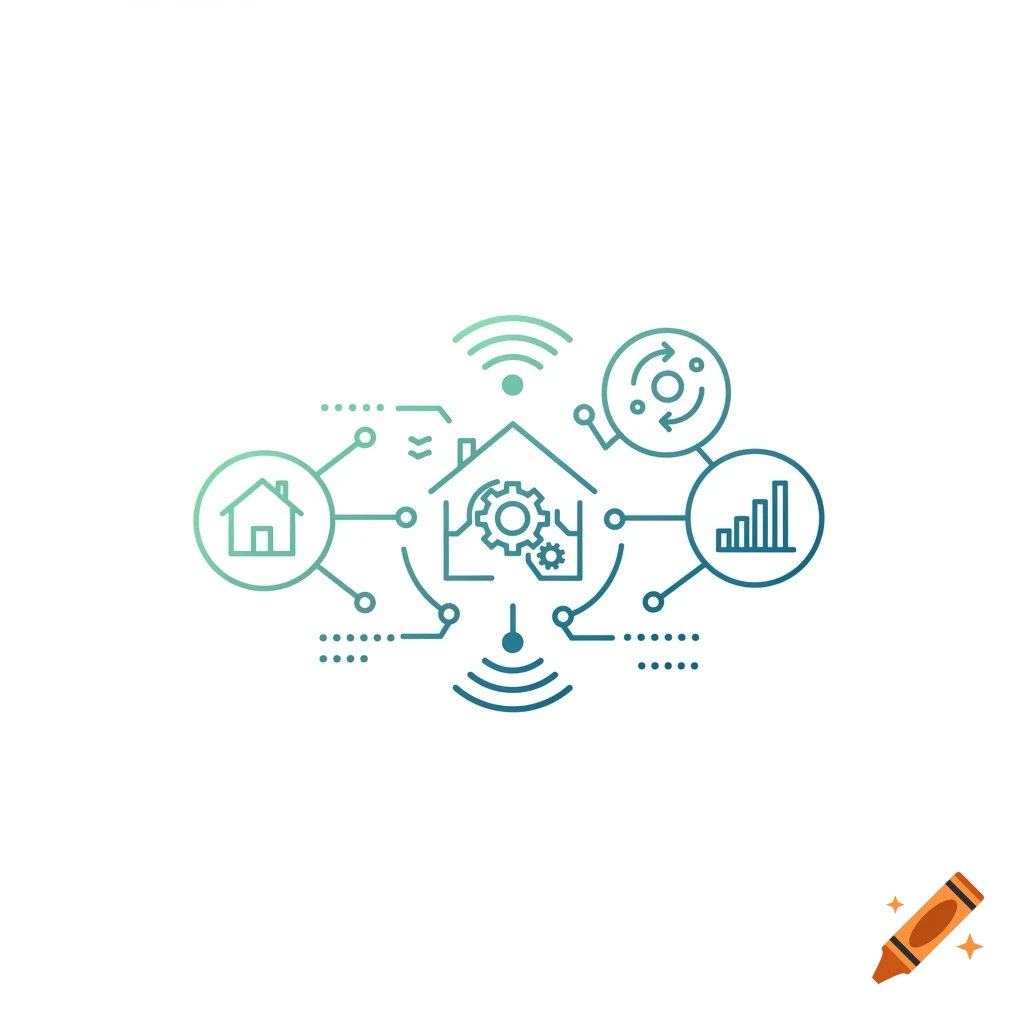
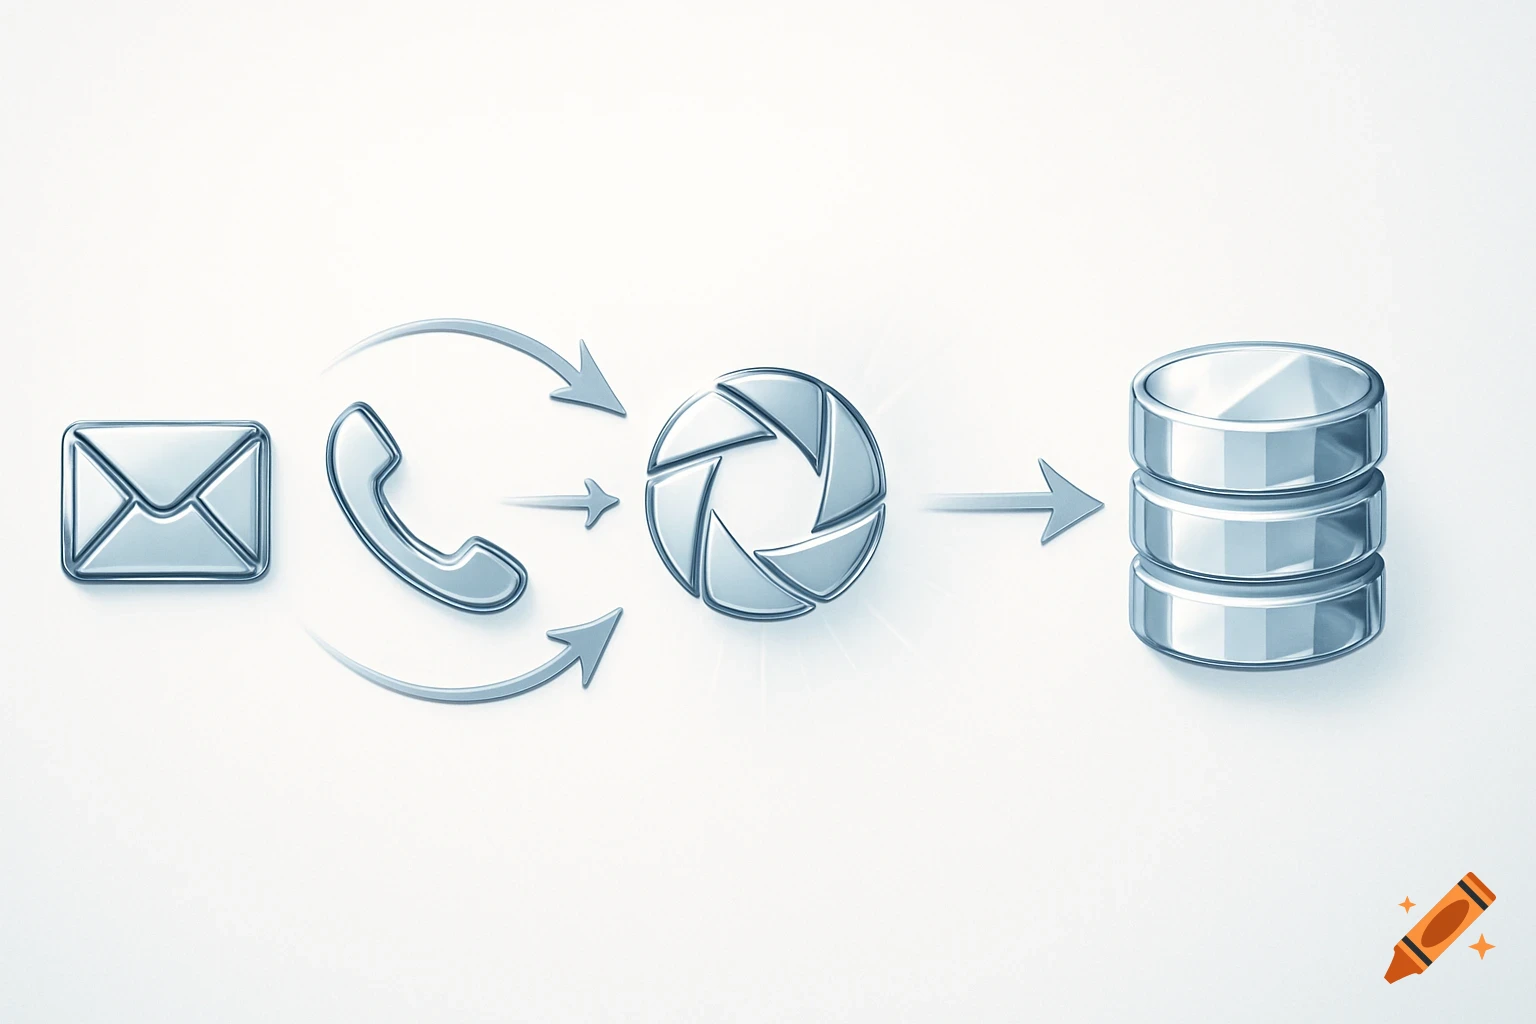
A technical diagram illustrating a data flow: IoT Sensors and GIS Information feed into the Maximo Application Suite, which then outputs to a Sustainability Dashboard.
I am creating a solution architecture where Iot sensors and GIS information is feed to mAximo application suite. From Maximo the sustainability dashboard will be displayed See more