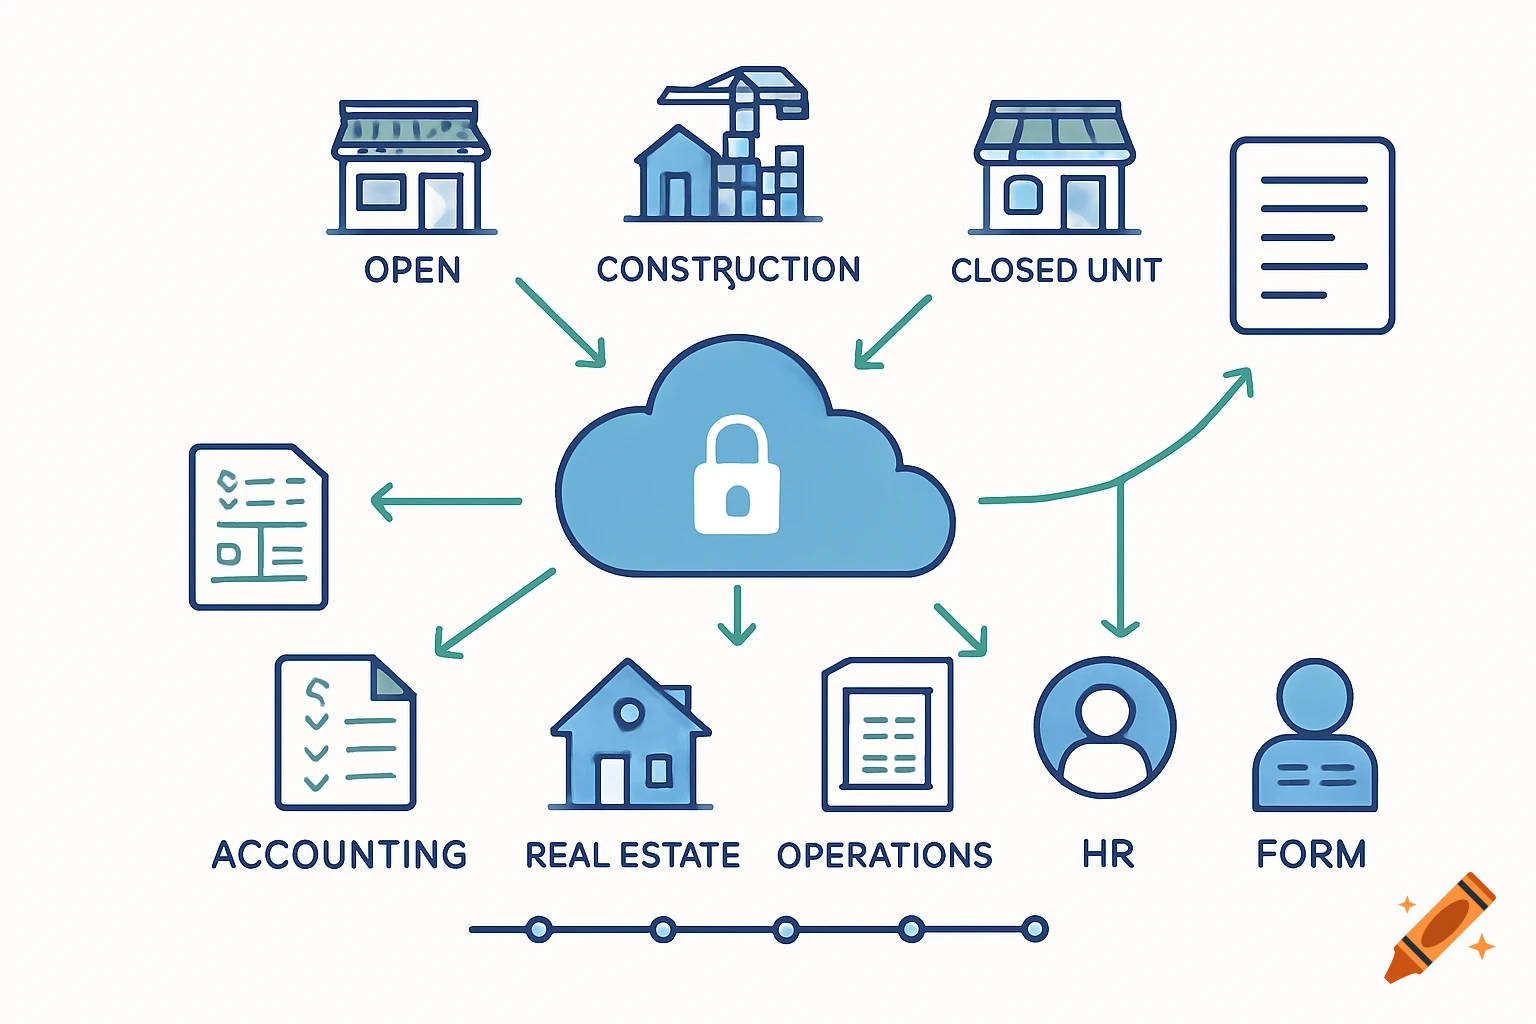
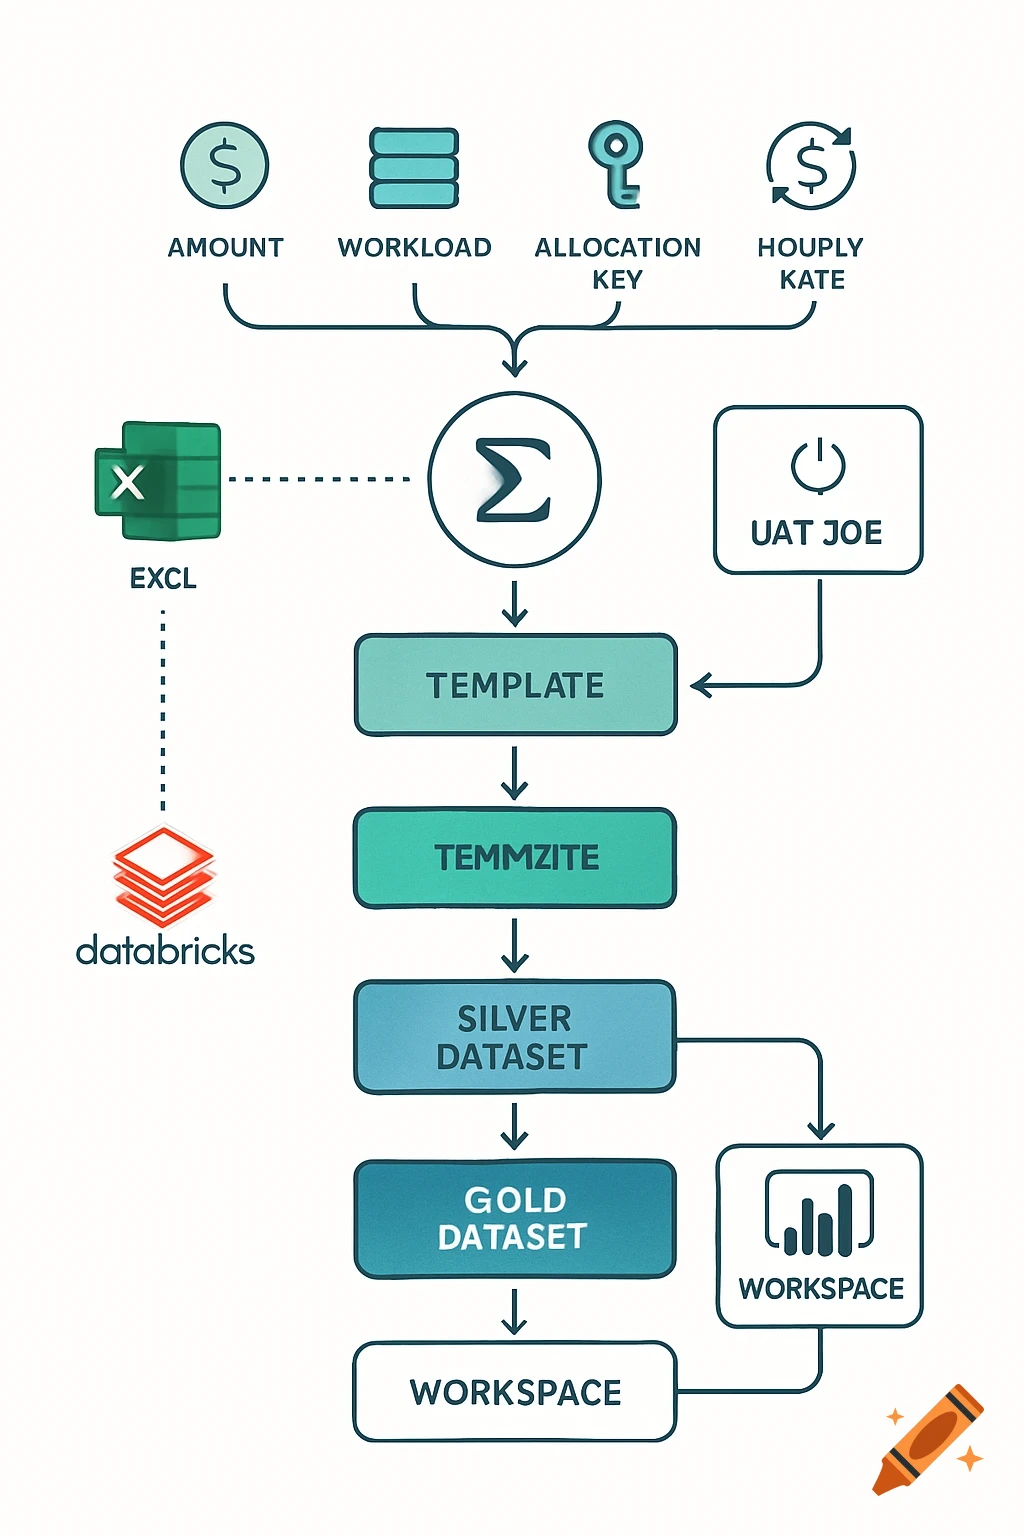
Infographic diagram illustrating data and information flow between architect, engineer, contractor, supplier, and client in a construction project.

An infographic showing the complexity of a construction project, featuring multiple stakeholders such as architects, engineers, contractors, suppliers, and clients. Include visual elements like interconnected arrows, data flow lines, and icons representing different roles and information exchange. Use a clean, professional style with labels and a clear layout to illustrate the interactions and data sharing among stakeholders. See more