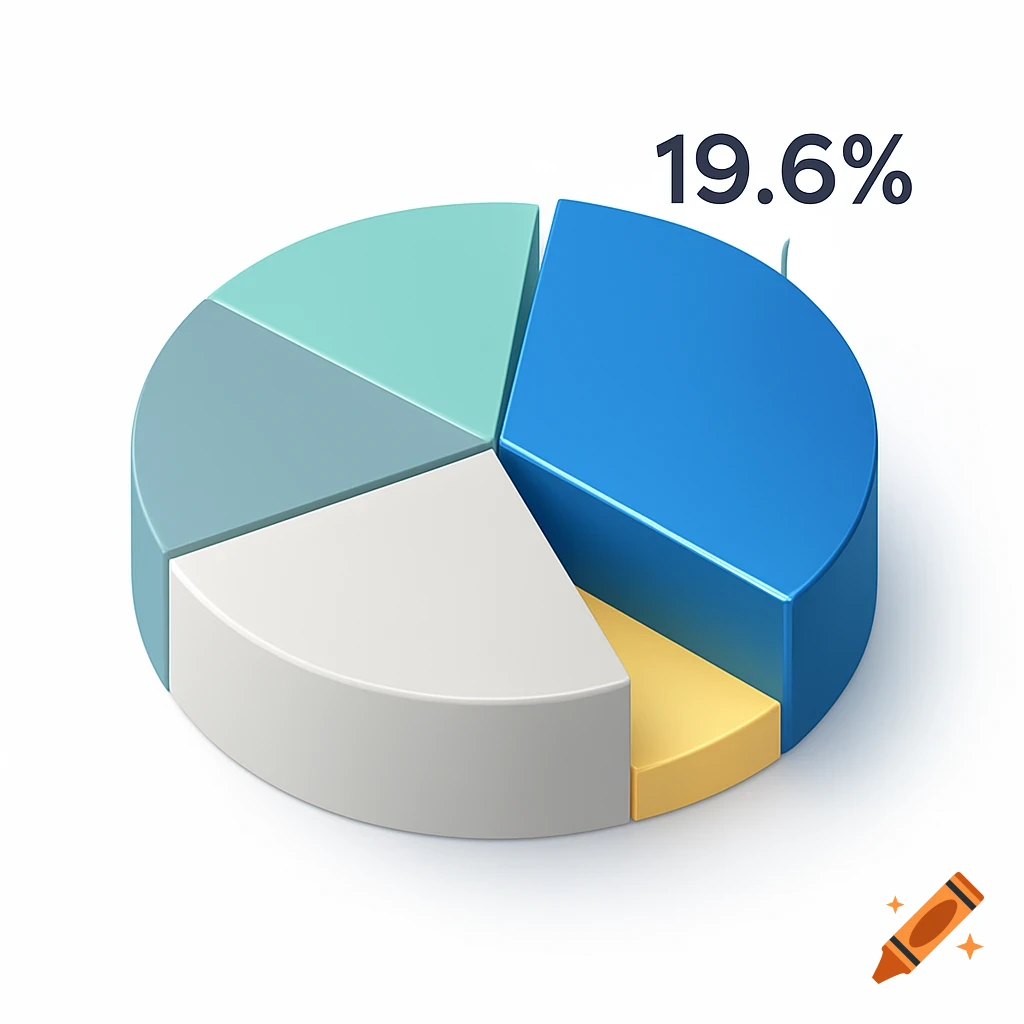
A colorful 3D pie chart showing percentages for Reusable (38%), Biodegradable (27%), Up-cycled (22%), and Carbon-neutral (13%).
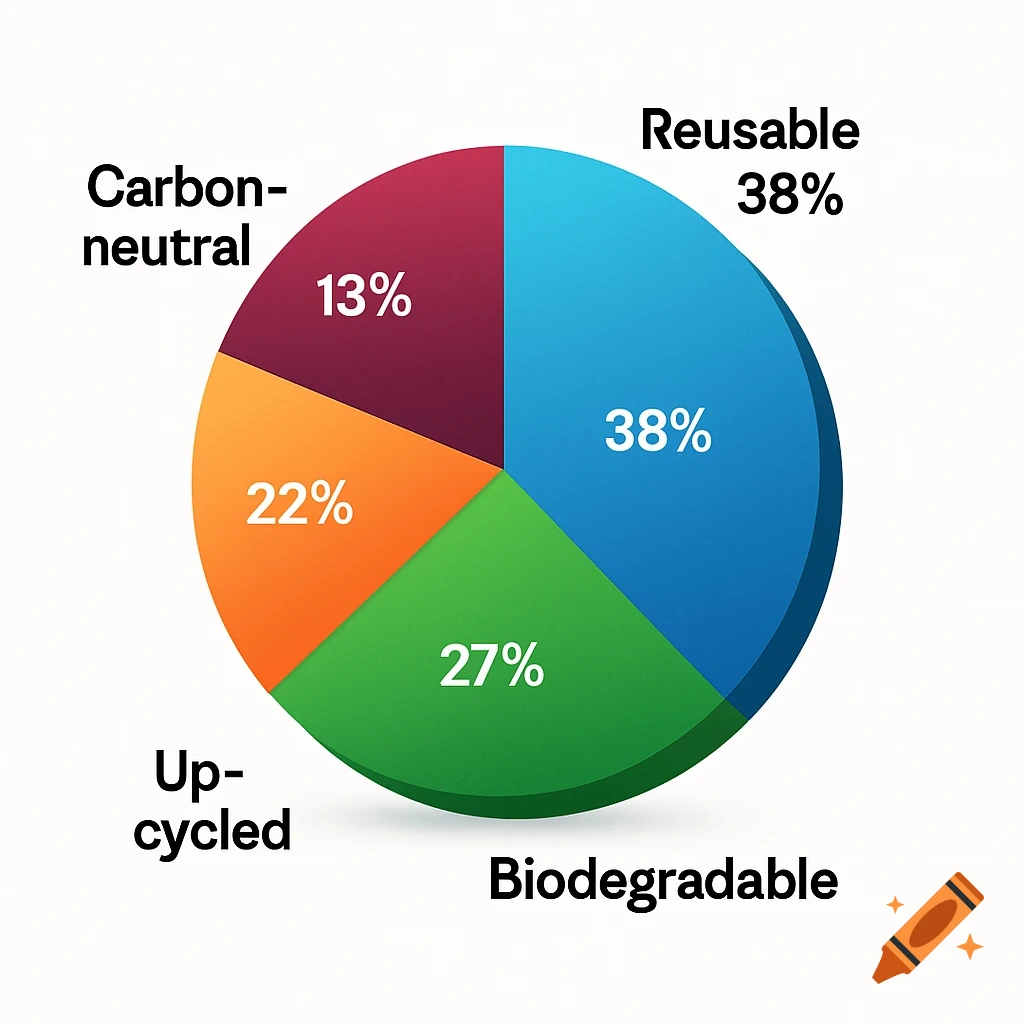
Absolutely! To improve the accuracy and quality of the images, I’ll refine the prompts to be more specific and detailed. This will help the AI generate images that better match your original descriptions. Here are the improved prompts for each of the first nine visuals: --- ### Improved Prompts for Image Generation **1. Consumer Preference Pie Chart** *“A professional, colorful pie chart with four segments labeled: Reusable (38%), Biodegradable (27%), Up-cycled (22%), Carbon-neutral (13%). The chart has clear labels, vibrant colors, and a clean style suitable for a research presentation.”* **2. Willingness-to-Pay Bar Chart** *“A clean, modern bar chart with four vertical bars labeled: Food (70%), Apparel (62%), Home (55%), Electronics (48%). Bright colors, axes labeled, with percentage labels on top of each bar, designed for a professional report.”* **3. Reusable Market Donut Chart** *“A detailed donut chart showing market share of reusable products: Stainless-steel bottles (45%), Beeswax wraps (20%), Silicone bags (17%), Bamboo cutlery (12%). Clear labels, vibrant distinct colors, and a modern style.”* **4. Plant-Based Food Sales Line Chart** *“A sleek line graph illustrating global sales of plant-based foods from 2018 to 2024, starting at $9 billion and rising to nearly $29 billion. The chart has labeled axes, a smooth trend line, and vibrant colors for clarity.”* **5. Adoption Map of Renewable Energy** *“A simple, colorful choropleth map showing regions with renewable See more