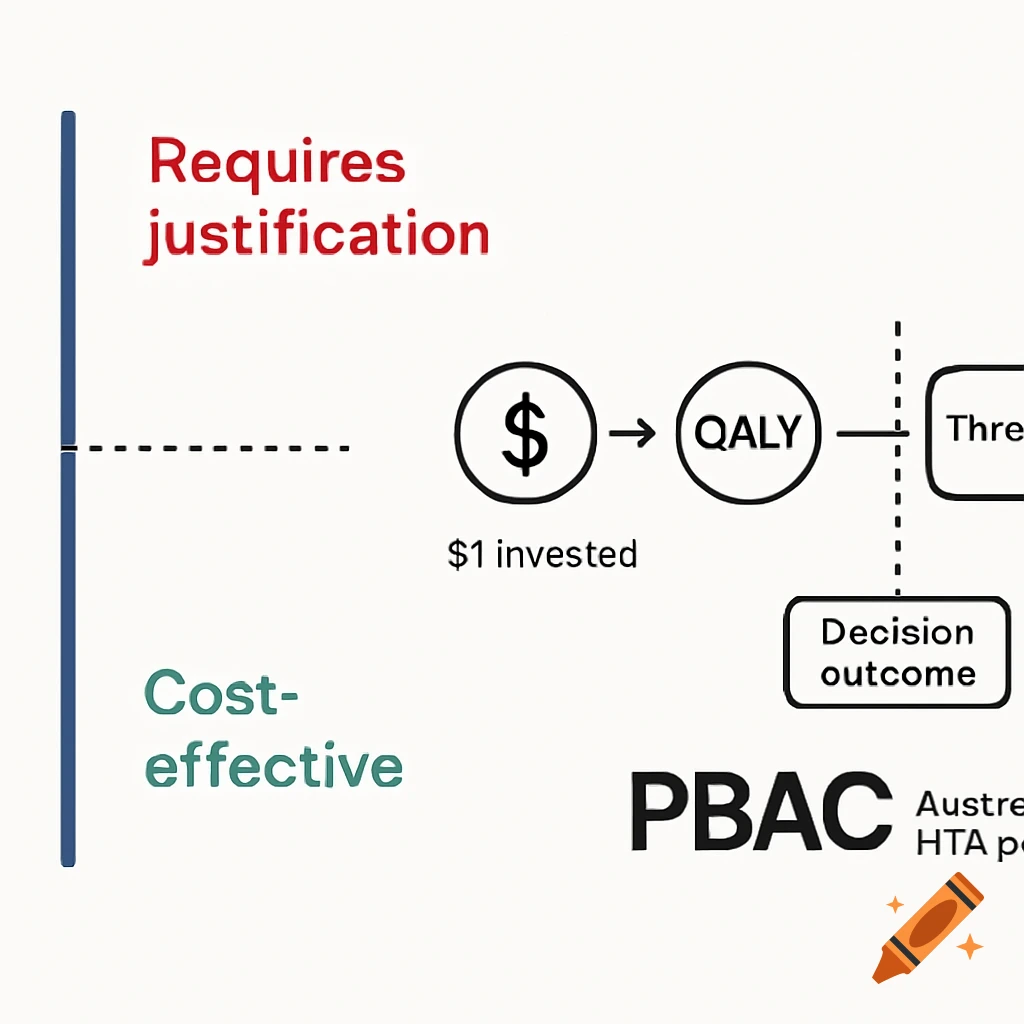
A vertical line graph showing: Interventions below $50,000/QALY = “Cost-effective” Interventions above = “Requires justification” A diagram showing: “$1 invested → QALY → Threshold → Decision outcome” PBAC logo or reference to "Australia-specific HTA practice" See more