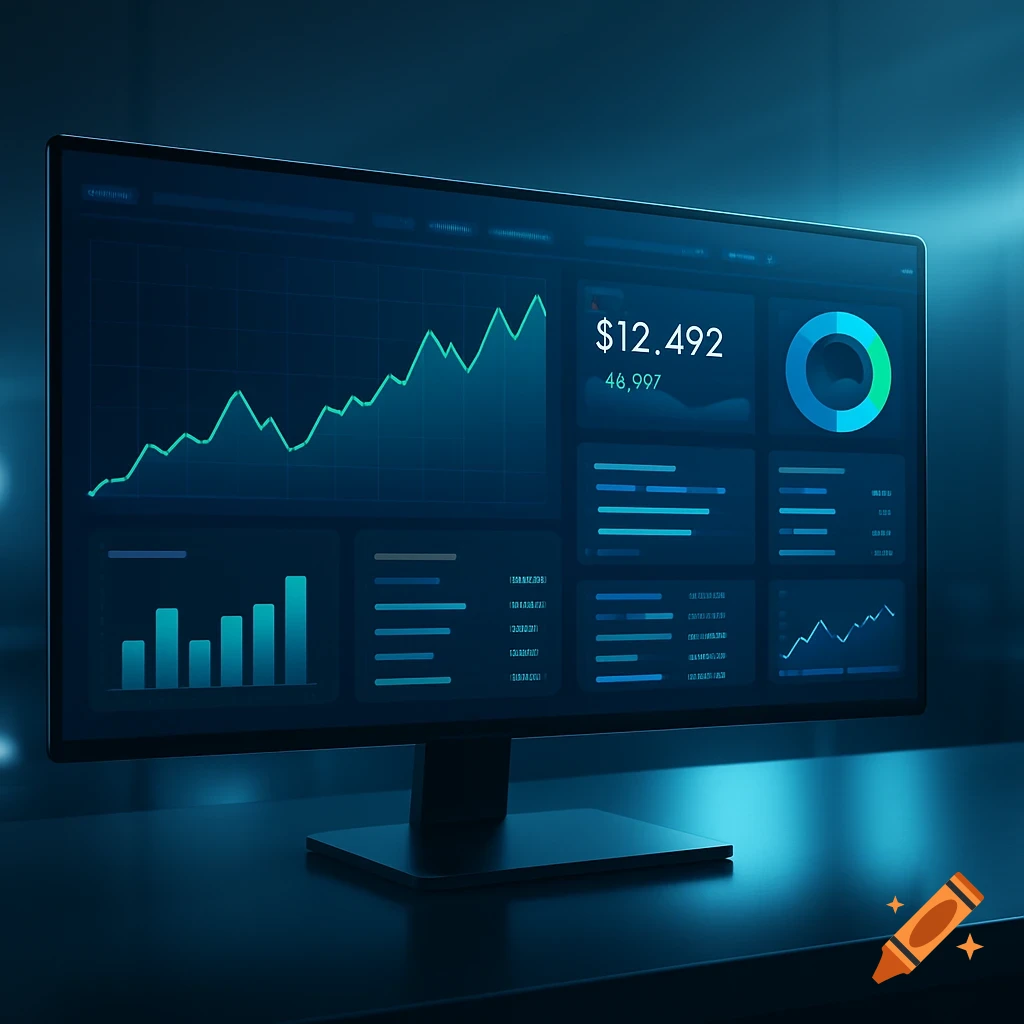
Split-screen dashboard comparing 'Vanity Metrics' with colorful charts and high numbers on the left, to 'Business Impact' with key metrics like revenue and growth on a dark, minimal interface on the right.
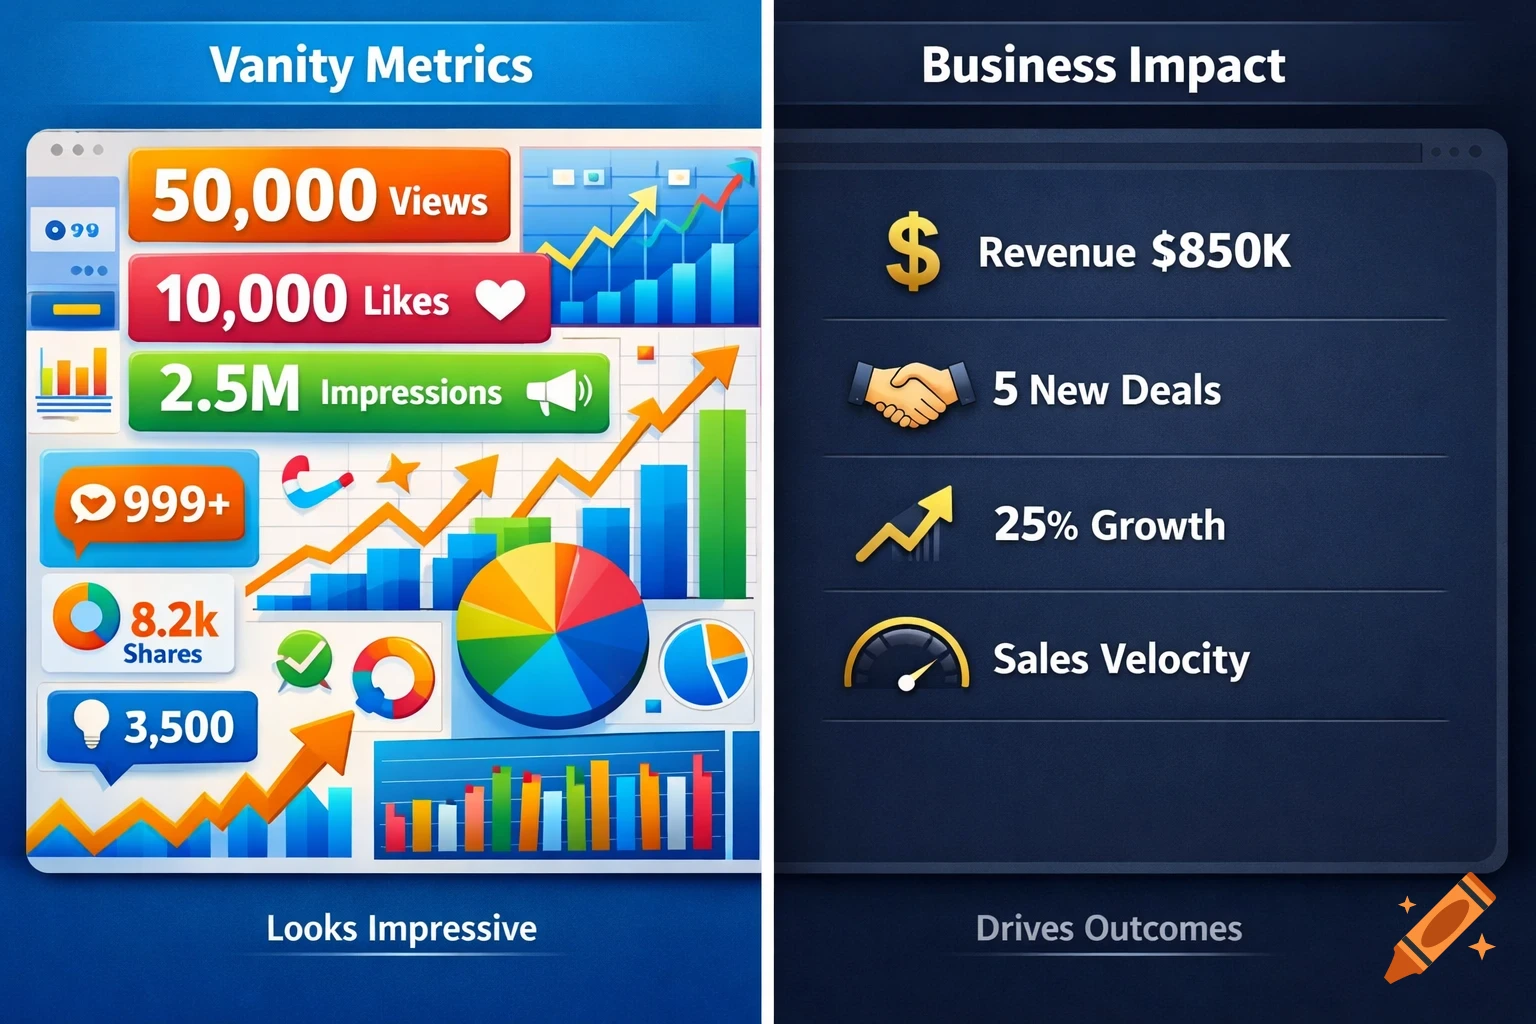
Create a professional split-screen comparison image for a LinkedIn business post about marketing metrics. The image is divided vertically down the middle: LEFT HALF - "Vanity Metrics": Show a busy, colorful dashboard interface displaying superficial metrics like "50,000 Views", "10,000 Likes", "2.5M Impressions" with multiple upward-trending graphs and charts. Use bright, saturated colors (blues, oranges, greens). The layout should feel cluttered and overwhelming with many data points competing for attention. Add small text at the bottom reading "Looks Impressive". Style should be flashy and surface-level. RIGHT HALF - "Business Impact": Show a clean, minimal dashboard with only 3-4 simple metrics clearly displayed. Include small icons representing business outcomes: a dollar sign (revenue), a handshake (deals), an upward arrow (growth), and a speedometer (velocity). Use a sophisticated color palette of deep blues, grays, and one accent color like gold. The layout should feel spacious and focused. Add small text at the bottom reading "Drives Outcomes". Style should be refined and strategic. Overall aesthetic: Modern, professional B2B design suitable for a SaaS company. No people, no photographs - pure data visualization and interface elements. The contrast should clearly show chaos vs. clarity, quantity vs. quality. See more