A consort diagram illustrating patient distribution for medications A, B, and C, with subsequent treatments and analysis numbers.
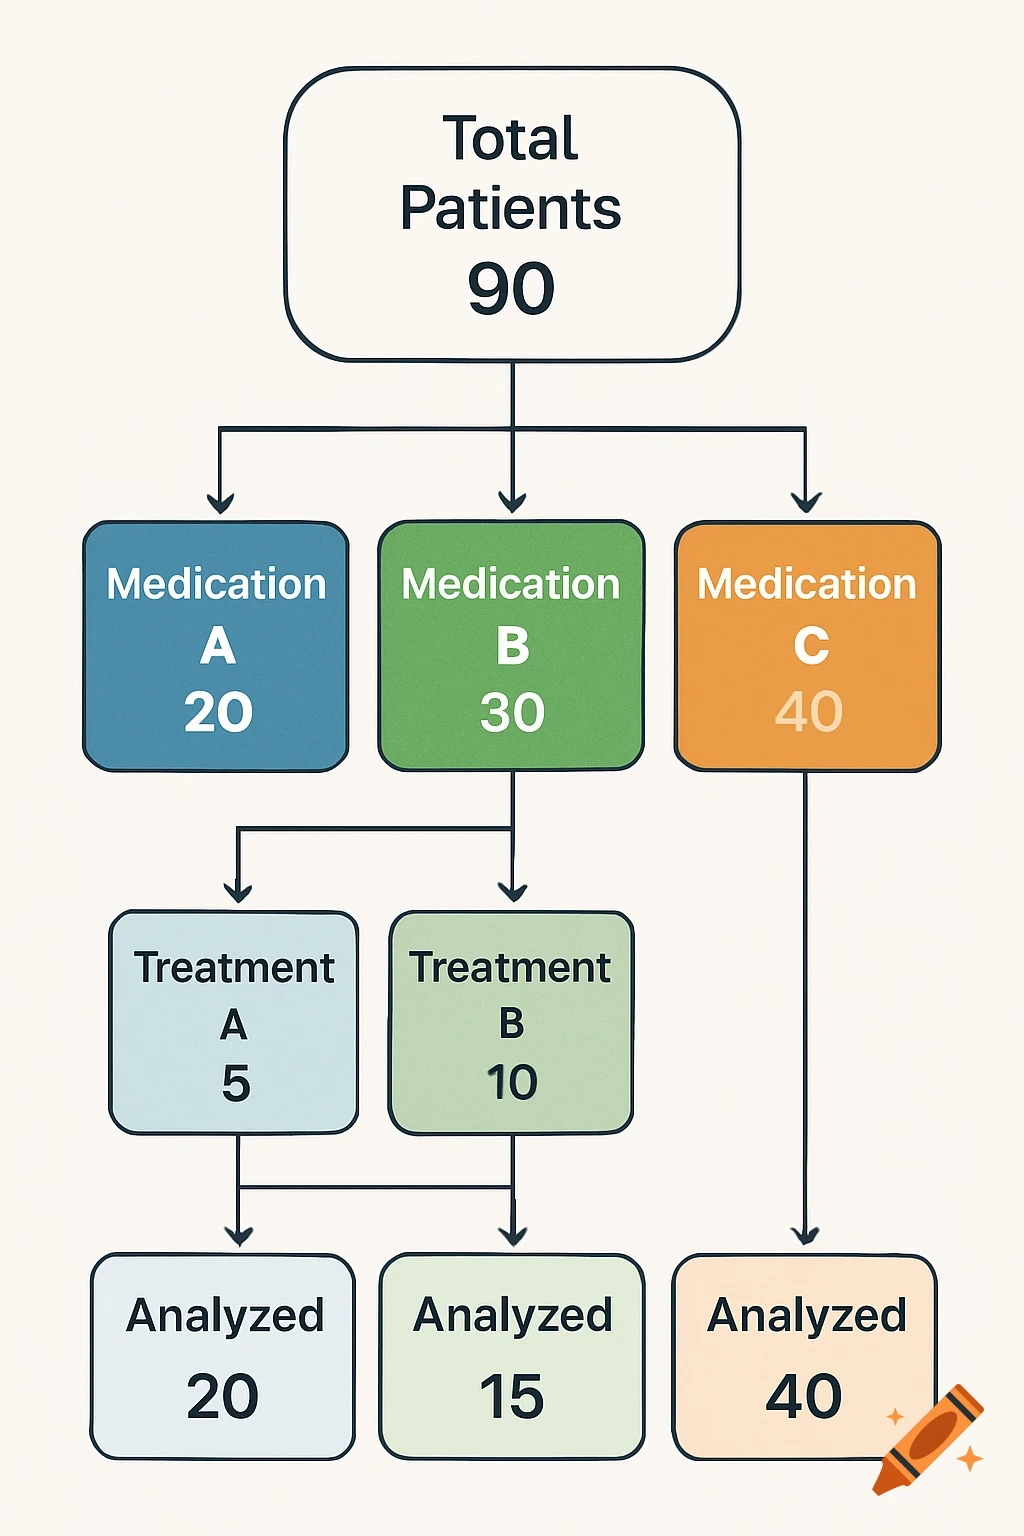
A consort diagram, with 90 patients in total. 20 patients get treated with medication A, 30 patients get treated with medication B and 40 patients get treated with medication C. From the patients treated with medication B, 5 get an additional treatment A and 10 get an additional treatment with B. For an additional analysis I want to include only each patient's last treatment. See more