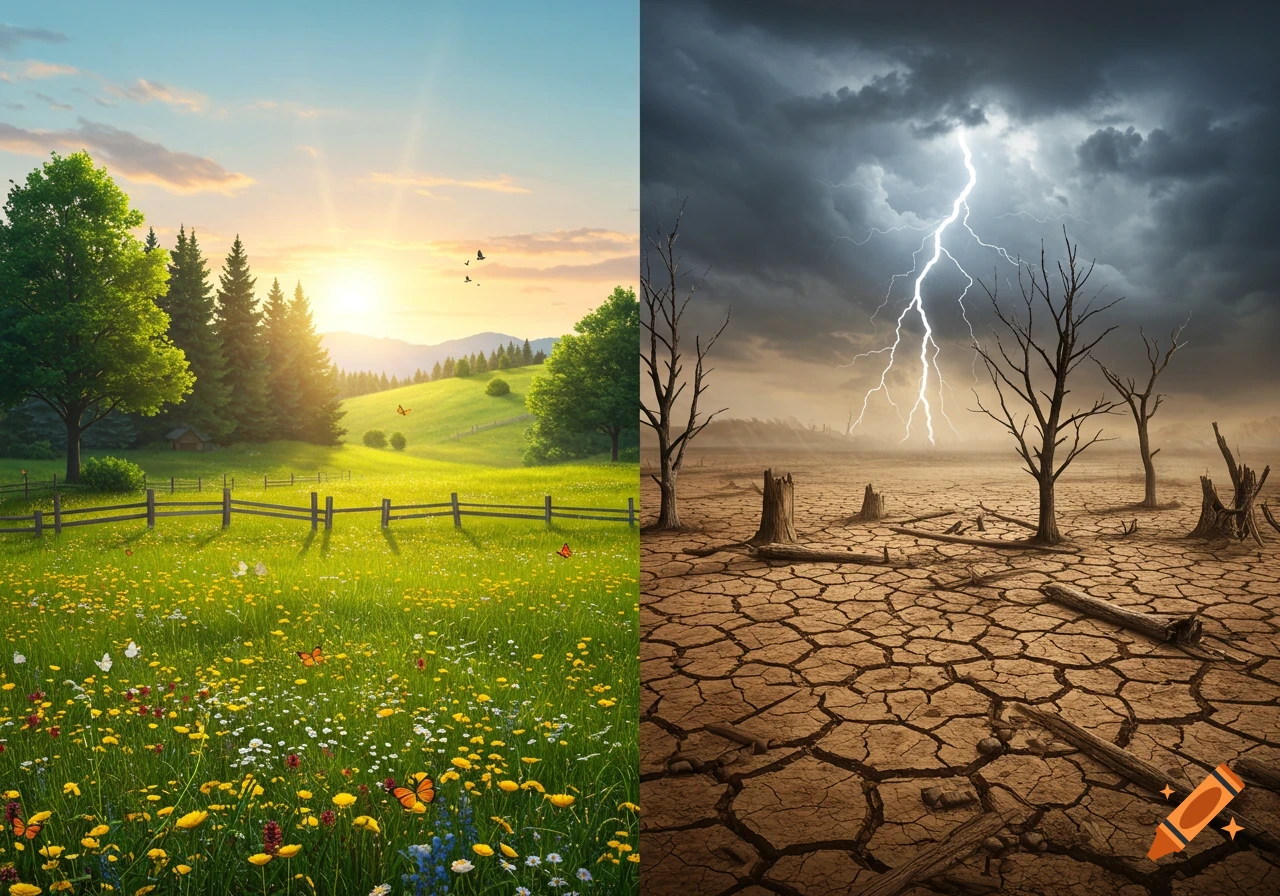
A flat design infographic comparing unpredictable agriculture with a worried farmer to predictable, AI-managed agriculture.
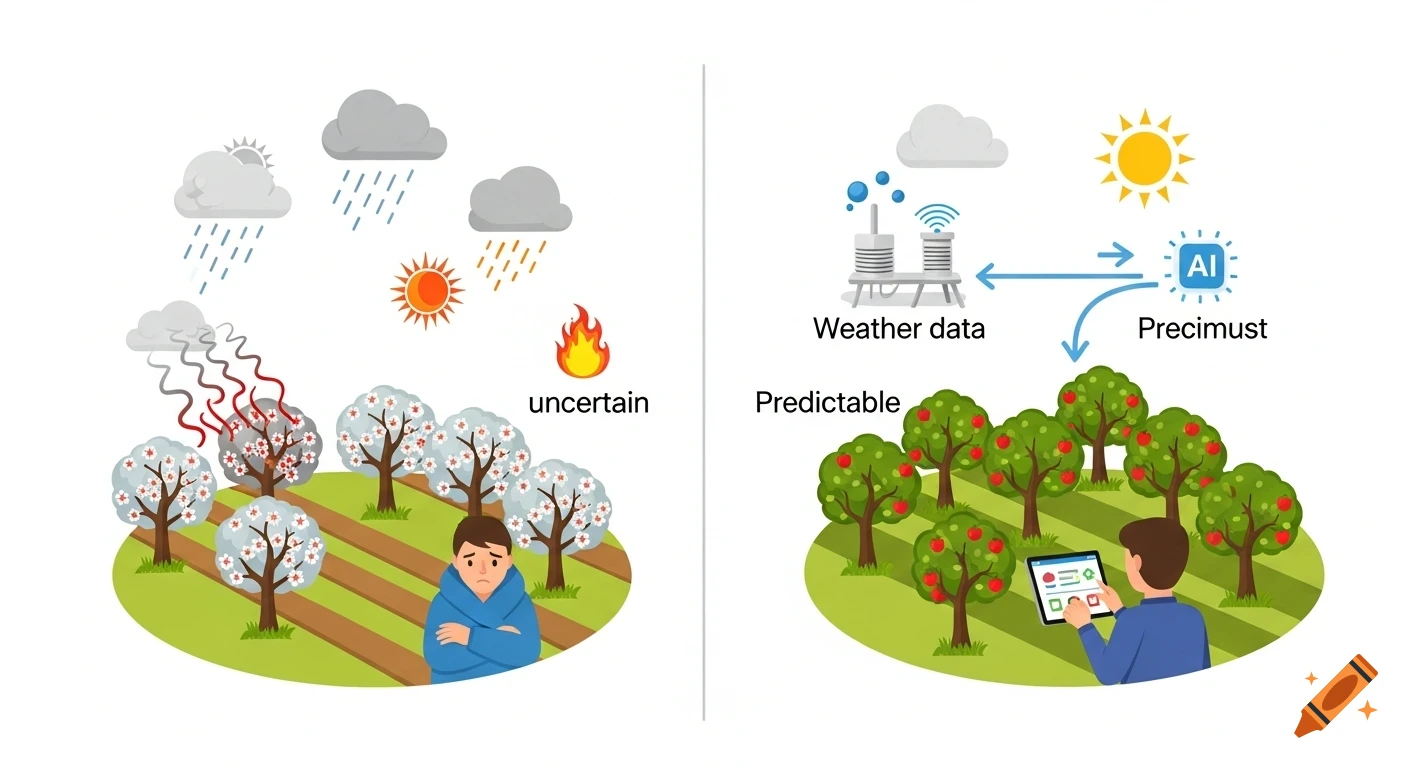
Create a simple, clean infographic with a single before-and-after comparison about agriculture and climate change. Left side (Before): an apple orchard with confused growth and unstable weather symbols (rain, heat, frost). The farmer looks uncertain. This represents unpredictable climate and unreliable traditional experience. Right side (After): the same apple orchard, now healthy and well-managed. A small weather station and a computer/AI icon show that weather data and plant growth data are used for prediction. The farmer confidently checks a tablet with a simple growth forecast. Use arrows to show the transition from “uncertain” to “predictable.” Style: minimalistic, flat design, calm natural colors, very few icons, no complex charts, no heavy text. Goal: clearly communicate that using weather data and prediction algorithms helps farmers better anticipate plant development under climate change. The apple trees are in the bloom state. And it is cold, so the farmer in the first part is afraid to loose all his harvest. The second one is better prepared, since he already can see the weather forecast of the frost in his prediction app. So he can protect his plants and harvest. See more