An edtech dashboard mock-up for AY 2025-26, featuring KPI cards for users, schools, and time on site. Includes bar charts for visits by grade and presentations, an engagement funnel, and metric tiles.
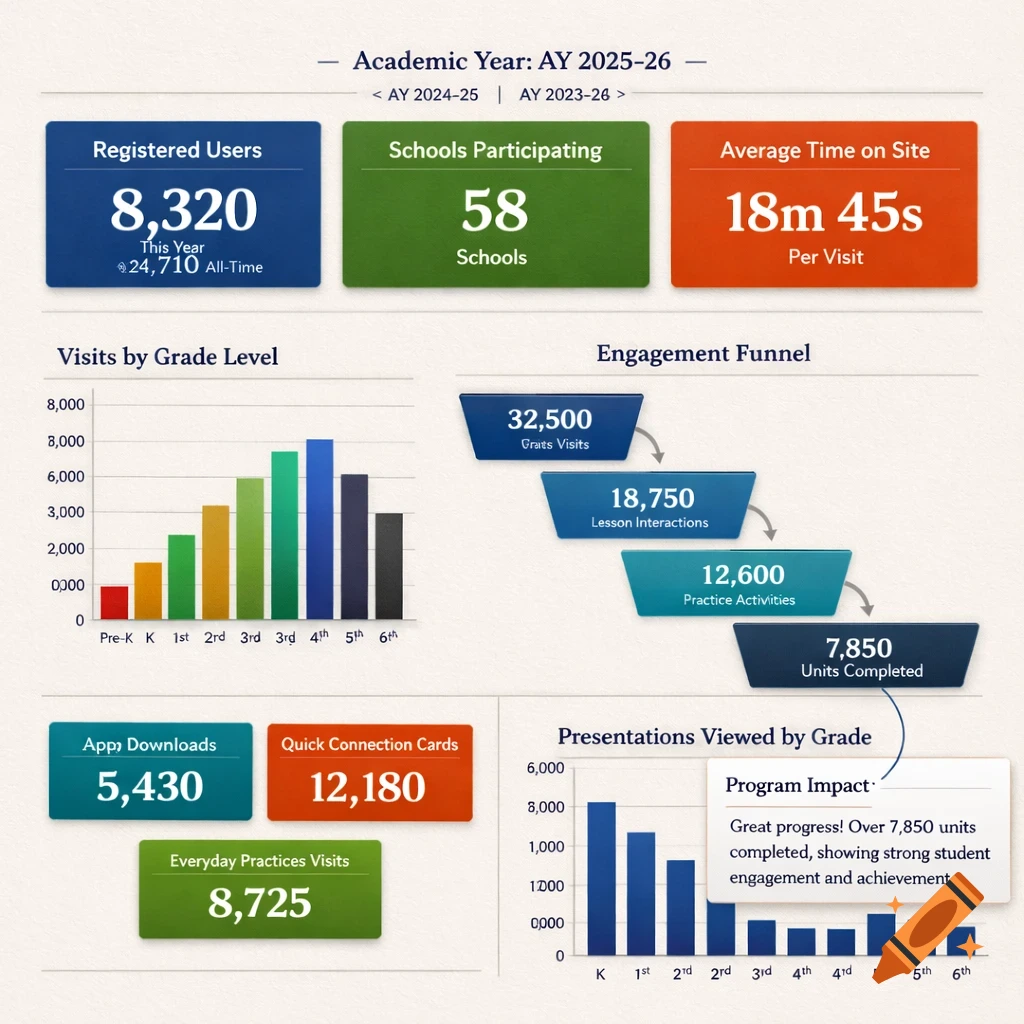
Realistic, client-facing edtech dashboard mock-up for a school district, modern and professional design. Light off-white background (#F2EDE9). Clean layout using a serif font similar to Besley. Brand colors: deep blue (#003A92), teal (#23BDC1), green (#85A511), orange (#DD4B24), charcoal (#333333), warm gray (#827B6E). Header: includes an Academic Year dropdown defaulted to AY 2025–26 with options for previous years. Top KPI cards (large, visually distinct): Registered Users (This Year / All-Time) Schools Participating Average Time on Site Scrolling dashboard layout with multiple charts: Bar chart: Visits by Grade Level (Pre-K through 6), labeled and color-coded. Engagement funnel showing: Grade Page Visits → Unit Page Visits → Lesson Page Visits → Lessons Completed → Units Completed. Bar chart: Presentations Viewed by Grade. Metric tiles: Supplemental App Downloads, Quick Connection Cards Accessed, Everyday Practices Page Visits. Interactive demo feature: One metric has a visible hover tooltip with an executive summary explaining program impact in plain language. Numbers: Realistic fake values (e.g., thousands of users, dozens to hundreds of visits), clearly readable. Style: Calm, credible, professional, education-focused, emphasizing program impact. Use subtle shadows, spacing, and hierarchy to make charts and KPIs visually clear and engaging. Output size: 1024x1024 (or 1920x1080 for full-width dashboard if supported). See more