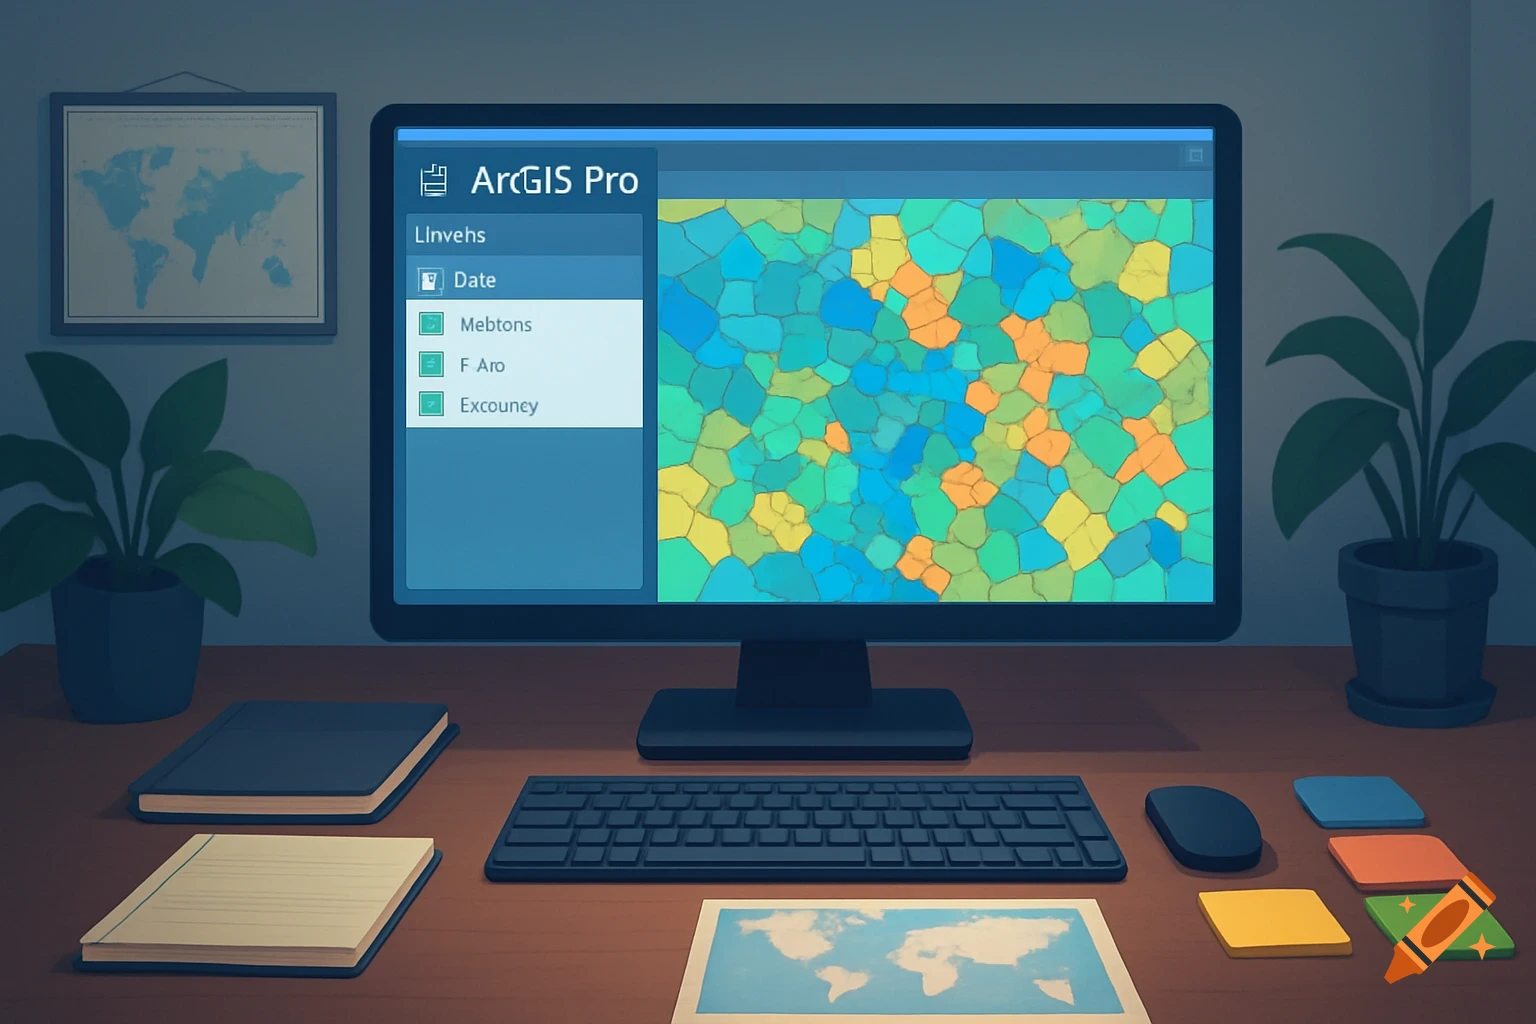
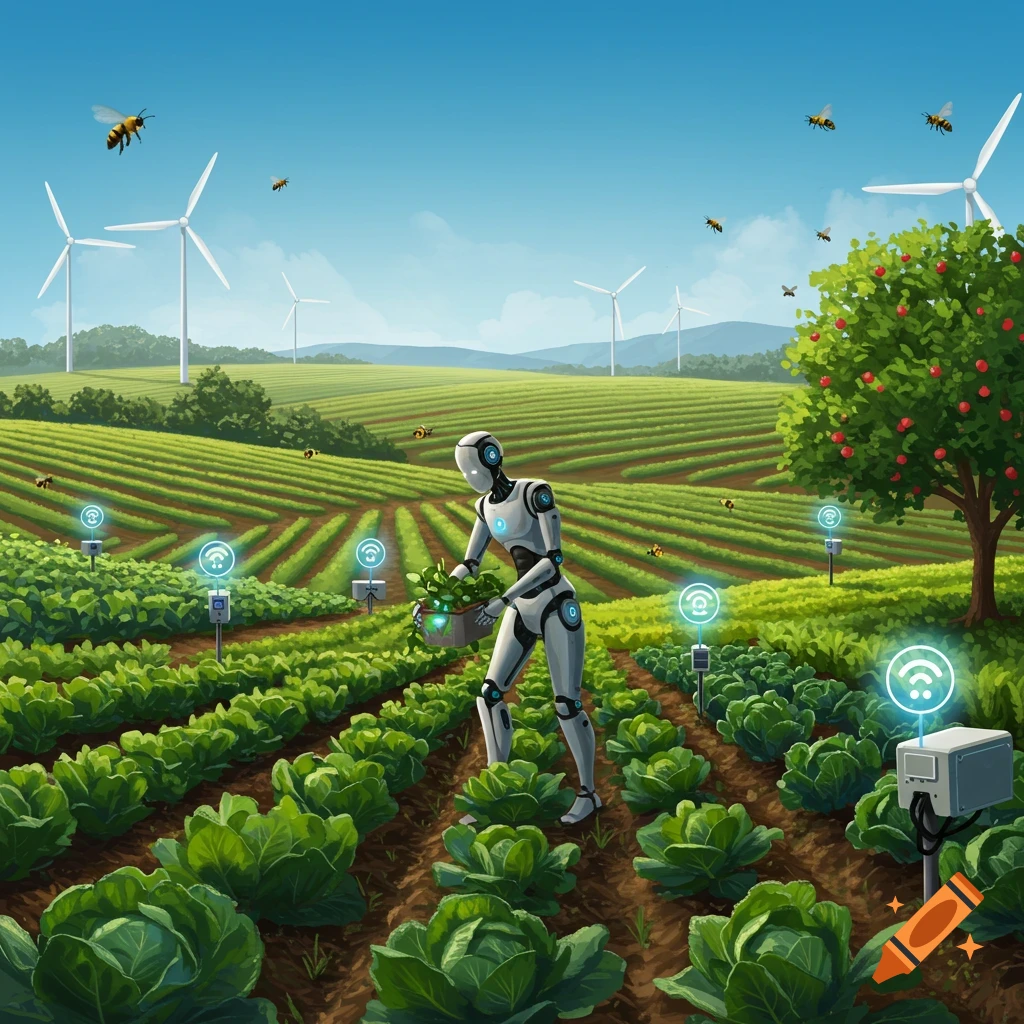
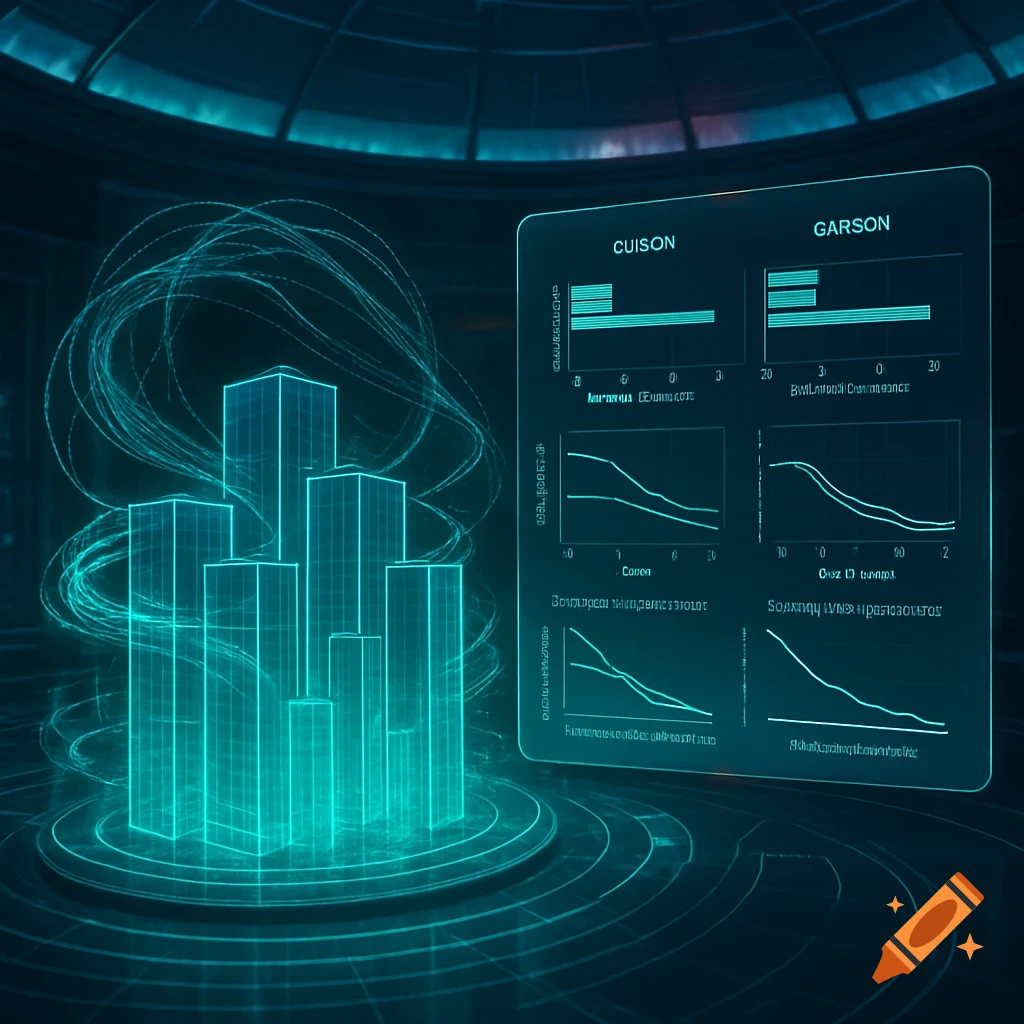
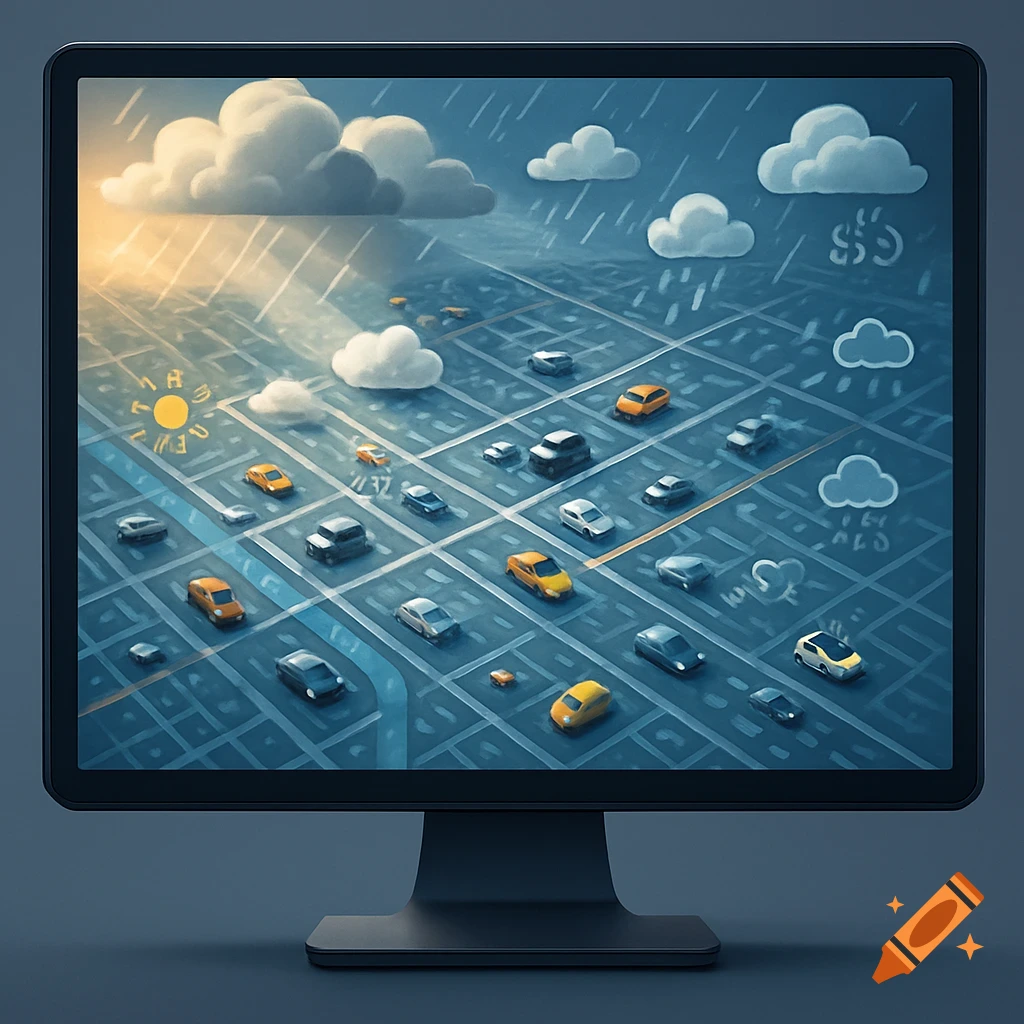
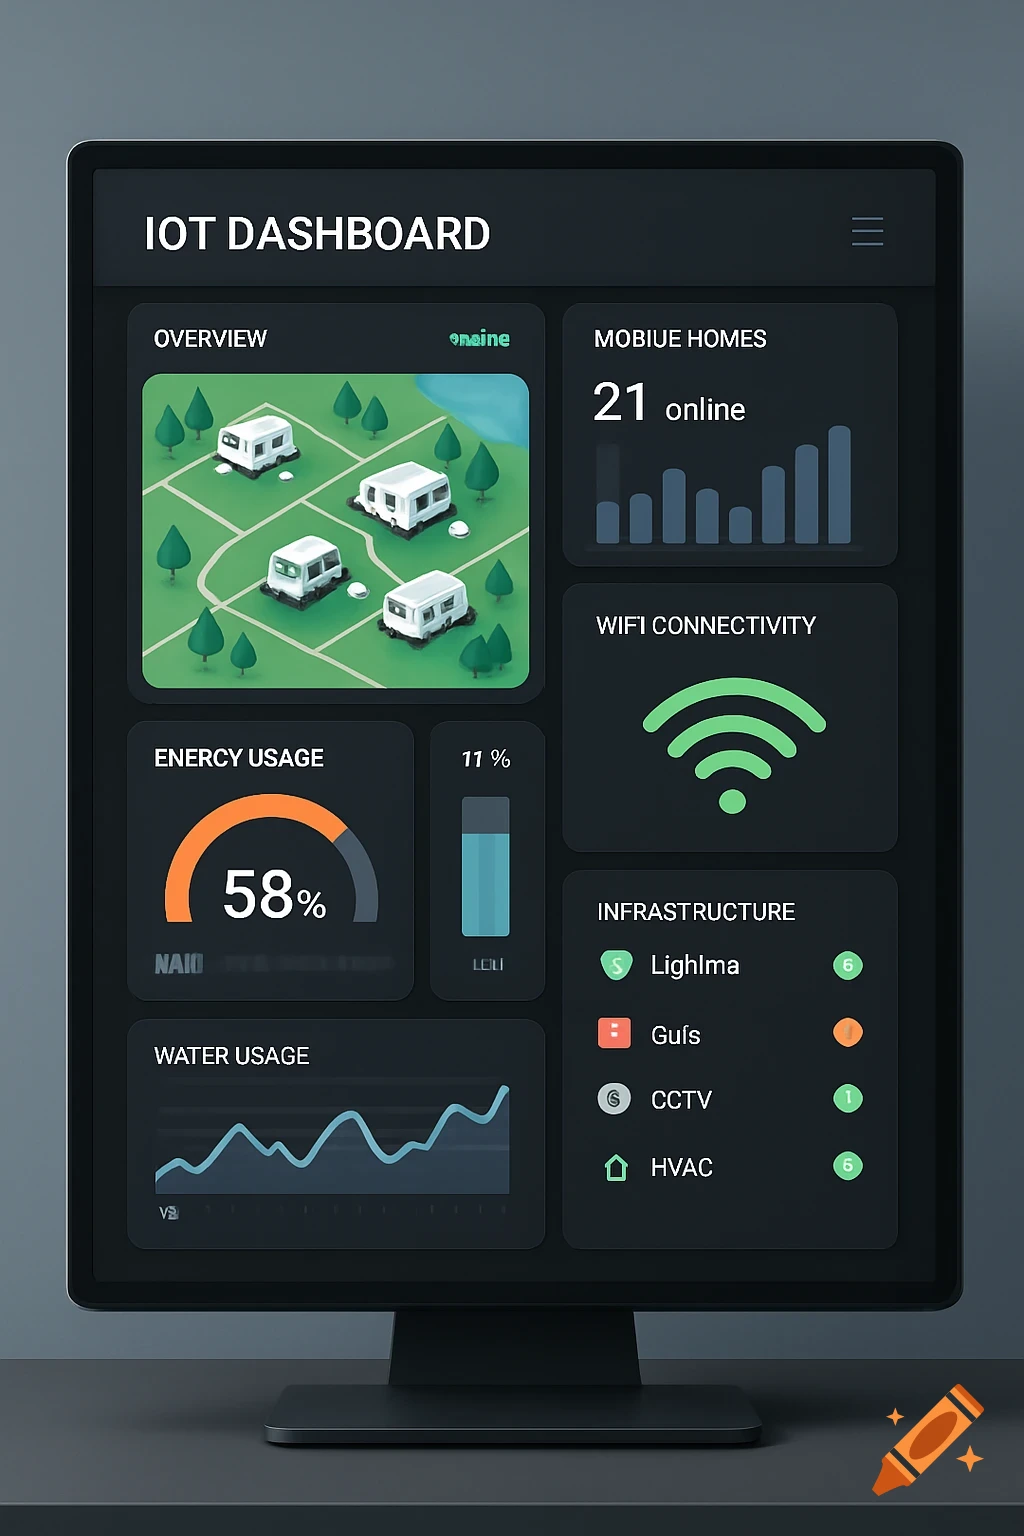
A modern dark-themed agricultural tech dashboard UI displays a digital map of farmland with green and red heatmap overlays for crop health and soil moisture data.
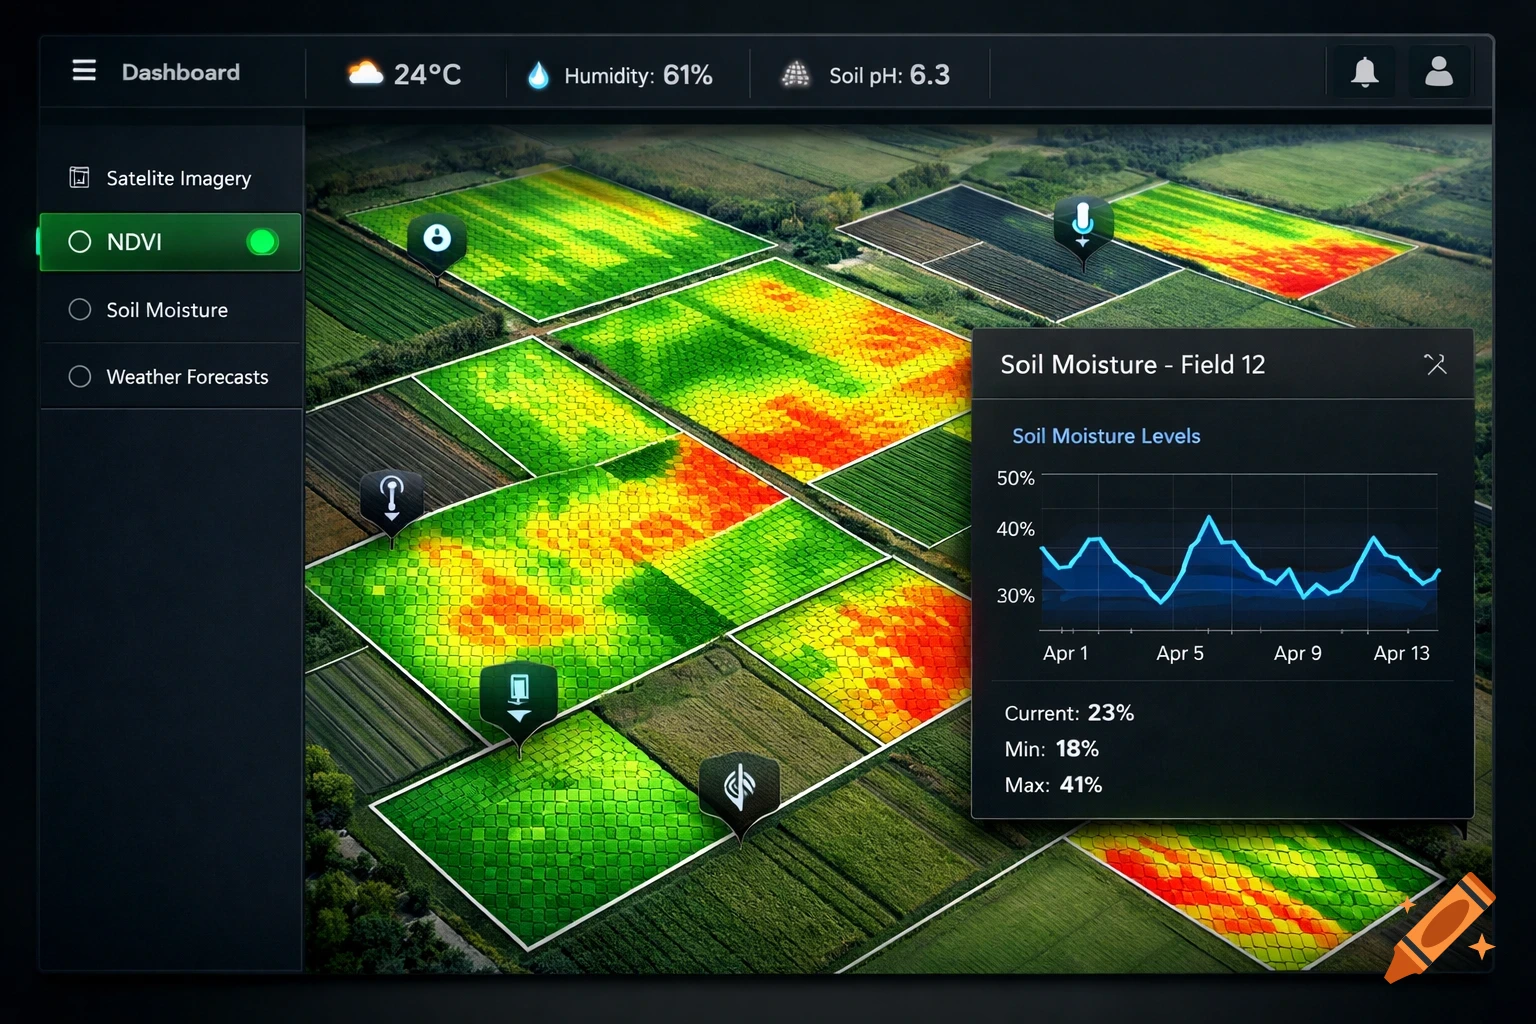
Professional UI/UX design, agricultural tech dashboard. An interactive digital map of farmland as the main interface. The map shows geometric field boundaries overlayed with semi-transparent multicolor heatmaps indicating crop health (NDVI index). Small IoT sensor icons are visible in the corners of some fields. A clean sidebar on the left shows layer toggles (Satellite, NDVI, Soil Moisture, Weather). A pop-up panel displays a time-series graph of soil moisture for a selected field. Style: modern, minimalist, data visualization, dark theme with green and blue accents, high detail, 4k. See more